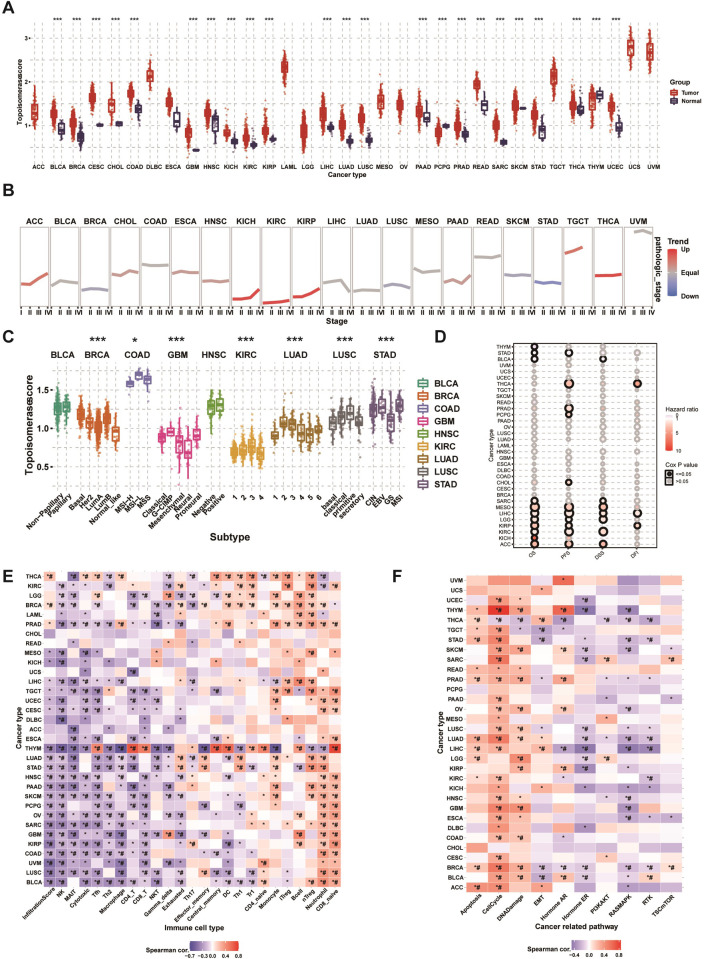
Fig 8. GSVA analysis of topoisomerase family genes.
(A) Differences of topoisomerase score in paraneoplastic and tumor tissues. The topoisomerase score represents the integrated level of the expression of topoisomerase family genes, which is positively correlated with gene expression. (B) Trend of topoisomerase scores from stage I to stage IV tumors. The blue trend line represents a decreasing score and the red trend line represents an increasing score. (C) Differences in topoisomerase scores among different cancer subtypes. (D) Survival analysis of topoisomerase score in different cancer types, including OS, PFS, DSS, and DFI. (E) Correlation heatmap between topoisomerase score and immune cell infiltration in different cancer types. *: P value≤0.05; #: FDR≤0.05. (F) Correlation heatmap between topoisomerase score and pathway activity in different cancer types. *: P value≤0.05; #: FDR≤0.05.

