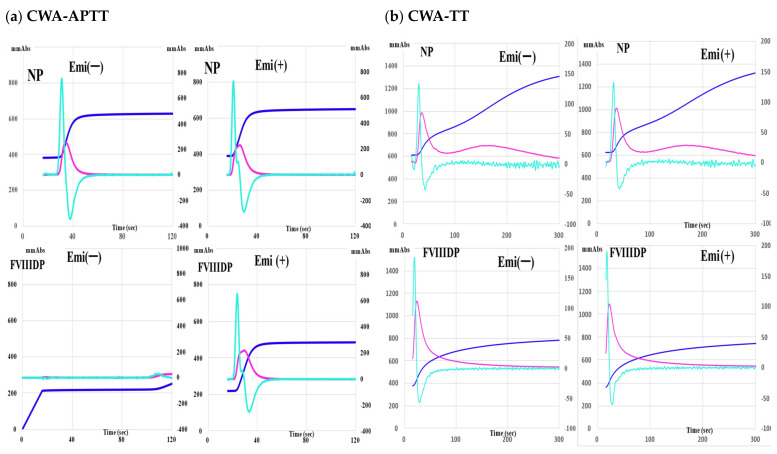
Figure 1.
Effects of emicizumab (0.15 mg/mL) on the clot waveform analysis (CWA). (a) Activated partial thromboplastin time (APTT). (b) thrombin time (TT); upper, normal plasma (NP); lower, FVIII-deficient plasma (FVIIID); Emi, emicizumab; navy-blue, fibrin formation curve; pink curve, 1st derivative curve; light-blue curve, 2nd derivative curve. All assays were performed more than three times to confirm the reproducibility.

