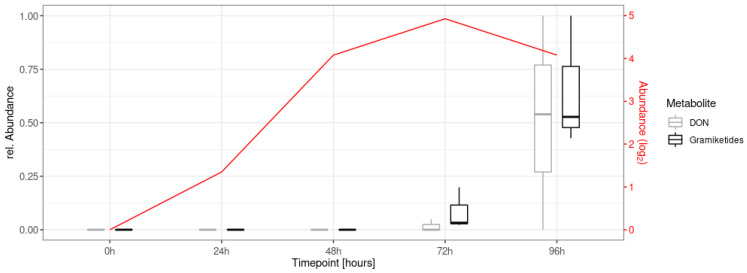
Figure 9.
Time course measurement of gramiketide B and deoxynivalenol (DON) abundances from samples taken immediately (0 h) to four days after infection (point inoculation of wheat flowers with F. graminearum PH-1 wild-type at anthesis). Peak areas are normalized relative to the highest value per metabolite. Transcription levels (for experimental details and methods of obtaining transcription data, refer to Schweiger et al. [41]) of the PKS15 gene (FGSG_04588) are shown in red.

