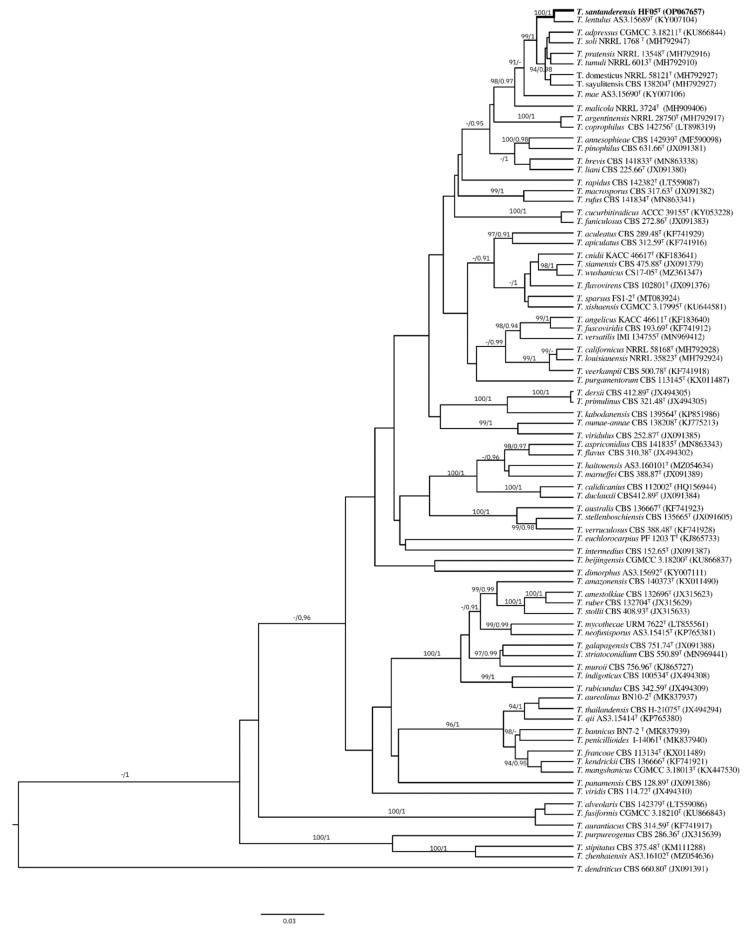
Figure 5.
Individual phylogeny of BenA. BI phylogram inferred from partial BenA sequences. Ultrafast-bootstrap percentages over 90% derived from 10,000 replicates and posterior probabilities over 0.9 of posterior support are indicated at the nodes. T indicates ex-type strains, strains belonging to new species are indicated in boldface. Scale Bars: number of substitutions per nucleotide position.

