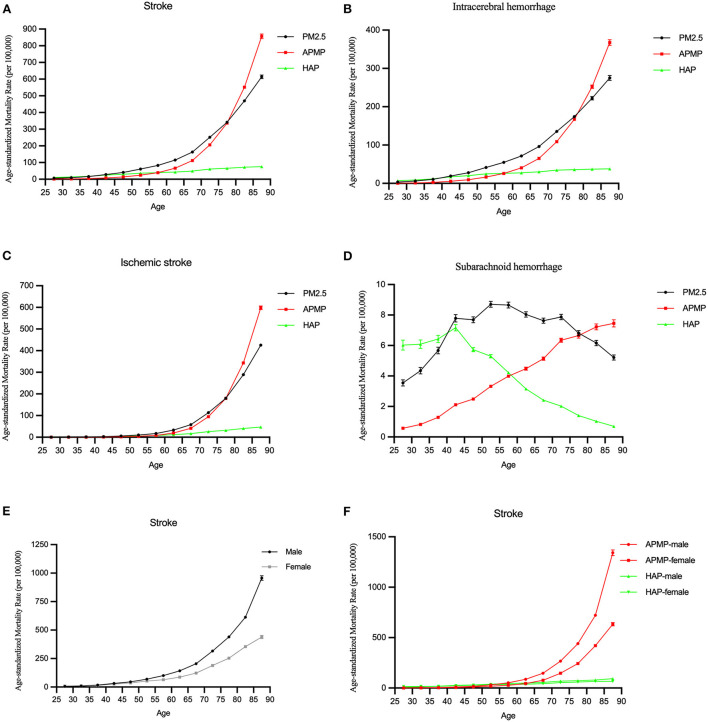
Figure 2.
The longitudinal age curves of the mortality rate of stroke attributable to PM2.5 exposure from 1990 to 2019. (A–D) The longitudinal age curves of stroke and subtypes for both sexes in PM2.5 exposure. (E) The longitudinal age curves of stroke by sex in PM2.5 exposure. (F) The longitudinal age curves of stroke by sex in ambient particulate matter pollution (APMP) and household air pollution (HAP).

