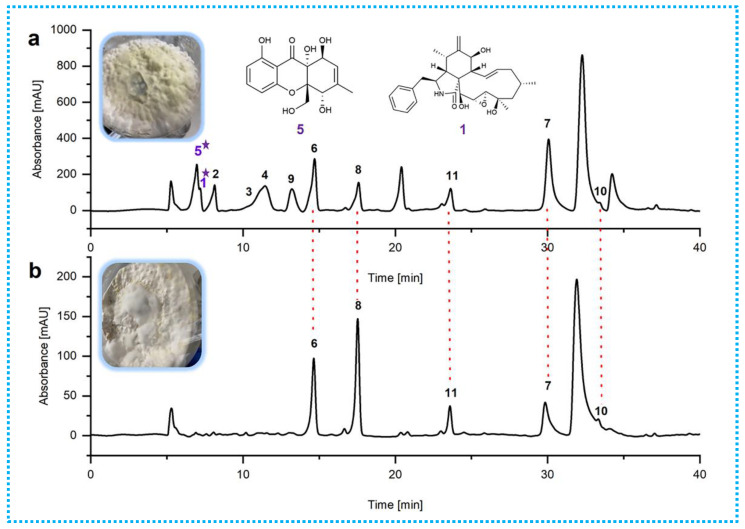
Figure 3.
HPLC profiles of fungal EtOAc extracts (a) obtained from rice solid-substrate medium after 50 µM sodium butyrate treatment and (b) obtained from rice solid-substrate medium without epigenetic inhibitor treatment. HPLC chromatograms: C18 column (Agilent Technologies 10 mm × 250 mm). Solvents: A, H2O; B, MeOH. Linear gradient: 0 min, 60% B; 40 min, 100% B. Temperature 25 °C. Flow rate 2 mL/min. UV detection at λ = 210 nm. Peaks 1–11 represent the isolated metabolites. ★ Compounds 1 and 5 in (a) represent the new compounds stimulated by epigenetic manipulation.

