Figure 5.
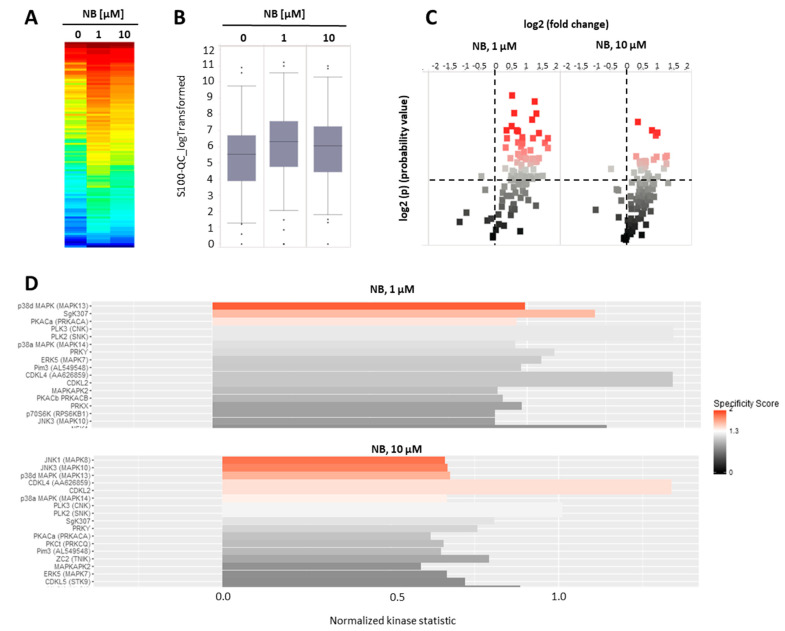
Kinome profiling of serine/threonine kinases (STKs). 22Rv1 cells were incubated with NB for 2 h; the proteins were extracted and STK were analyzed using functional kinome profiling. The heatmap displays the log2-transformed signal intensities for each sample. The signals were sorted from high (red) to low (blue) intensity/phosphorylation (A). The overall peptide phosphorylation and, with that, the overall kinase activity is shown by the box plot (B). The volcano-plot identifies significantly altered peptides. Red dots indicate significantly increased phosphorylation of peptide substrates compared to control samples (log2(p) > 1.3, dotted line (C). (D) Upstream kinase analysis indicating effect of the treatment on STK in 22Rv1. The top kinases predicted to be affected are shown, with all kinases displaying normalized kinase statistic > 0 (X-axis), meaning higher activity of these kinases in cells treated with NB in comparison to control; specificity score > 1.3 indicates statistically significant changes. Number of replicates n = 3.

