Figure 1.
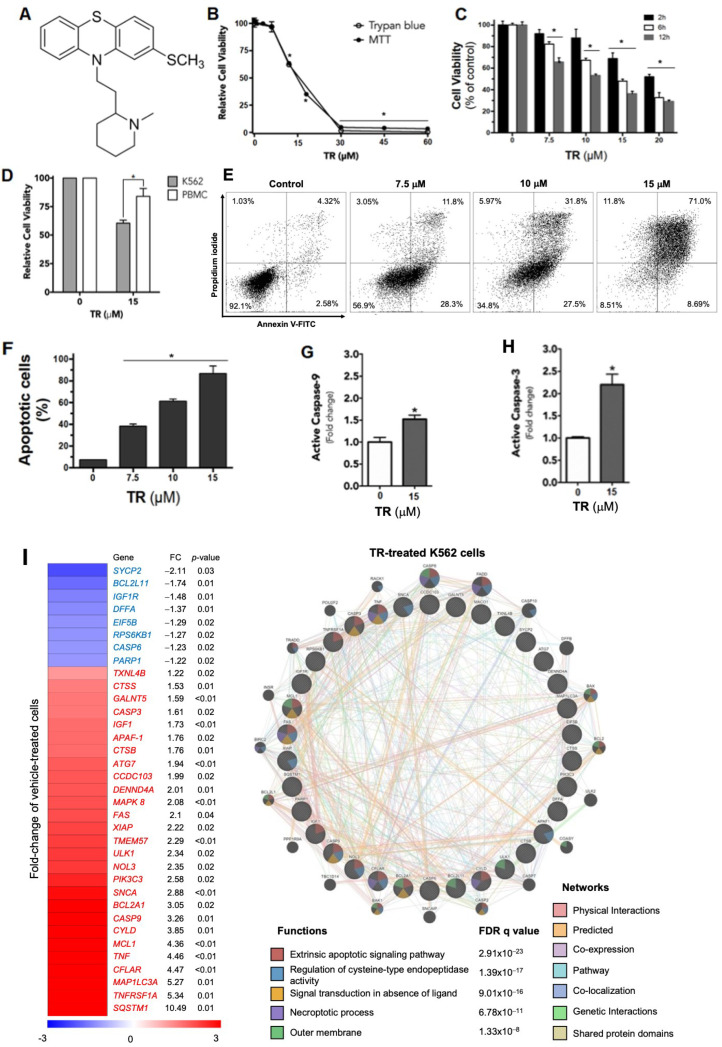
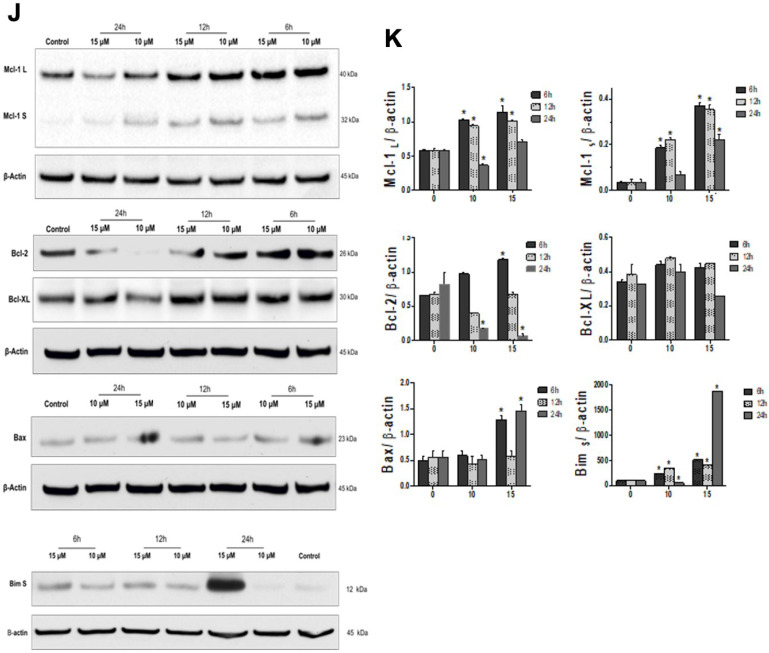
TR Induces Cell Death Selectively in Leukemia Cells. (A) Chemical structure of thioridazine (TR). (B) Viability of K562 cells in the presence of 0–60 µM TR incubated for 24 h using MTT reduction (empty circles) and trypan blue exclusion assays (full circles). (C) Viability of K562 cells in the presence of 0–20 µM TR incubated for 2 h (black bars), 6 h (white bars), and 12 h (grey bars) evaluated by MTT reduction assay. (D) Viability of K562 cells (grey bars) and PBMCs (white bars) treated with 15 µM TR for 24 h, assayed by MTT. In (A–C), data are expressed as percentages of viable cells (mean ± SD) calculated about control (i.e., without TR), considered to be 100%. (E) Representative flow cytometry dot plot of annexin V-FITC/PI doubled-stained in K562 cells incubated for 24 h with 15 µM TR. The number in each quadrant is the percentage of events. (F) Quantification of apoptotic annexin-V-positive cells (lower and upper right quadrants); data are expressed as percentages of apoptotic cells (mean ± SD). (G) The activity of caspase-9 in K562 cells incubated with 15 µM TR for 24 h determined spectrophotometrically. (H) Active caspase-3 in K562 cells upon incubation with 15 µM TR for 24 h by flow cytometry using a monoclonal antibody. Caspase-9 and -3 are expressed as fold changes (mean ± SD) about control. (I) Gene expression heatmap from qPCR array analysis of K562 treated with vehicle or 15 μM TR for 6 h. The mRNA levels were normalized to those of vehicle-treated K562 cells and calculated as fold changes in expression; genes with their expression significantly modulated in either direction are included in the heatmap. Network analysis for genes modulated by TR was constructed using the GeneMANIA database (https://genemania.org/, accessed on 29 June 2022). The upregulated and downregulated genes in the PCR array are illustrated as crosshatched circles, and the interacting genes included by the software modeling are indicated by circles without crosshatches. The main interactions between genes are indicated by colored lines and the five main cellular processes are described in the Figure. The p and FDR q values are indicated. (J) Modulation of the expression of Bcl-2 family proteins by TR (10 and 15 µM) incubated for 6, 12, and 24 h with K562 cells. Cells cultivated for 24 h in the absence of TR were used as control, and no significant differences were observed compared to 6 and 12 h (not shown). (K) Densitometry bands were quantified and normalized by their respective β-actin bands. Values are expressed as means ± SD. * Statistically different (p < 0.05).


