Figure 4.
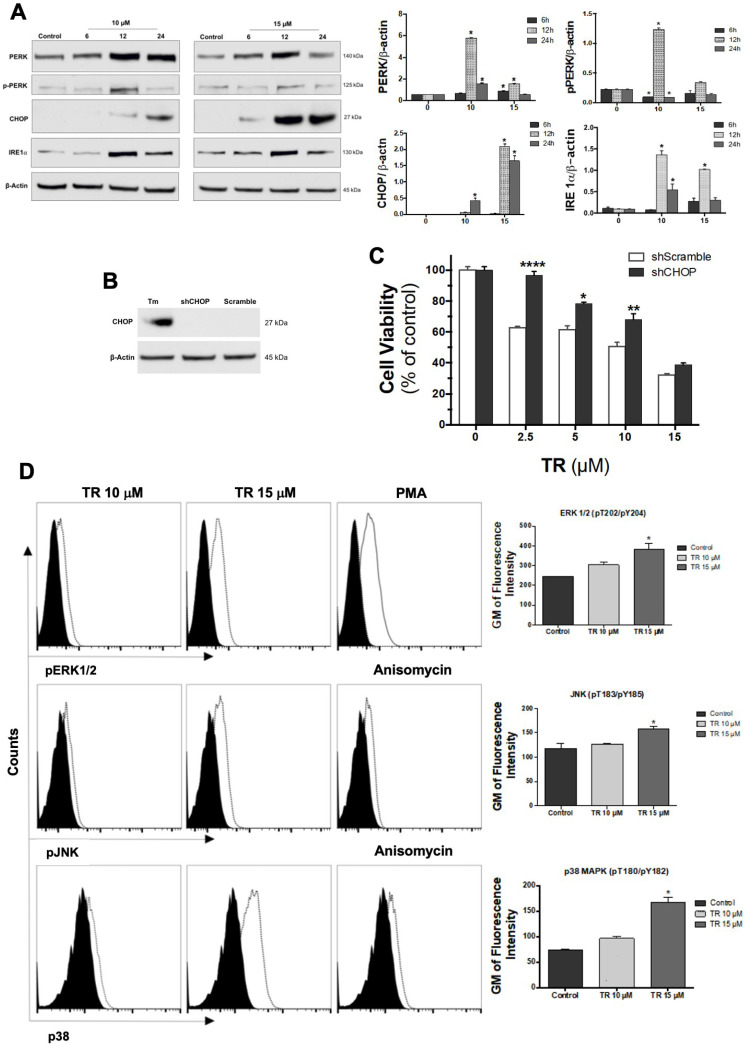
TR Induces ER Stress-Mediated Apoptosis. (A) Expression levels of UPR and ER stress proteins induced by 10 and 15 µM TR incubated with K562 cells for 12 and 24 h. Densitometry bands were quantified and normalized by their respective β-actin bands. Values are expressed as means ± SD. * Statistically different from the control (p < 0.05). (B) CHOP knockdown in K562 cells. CHOP expression was stimulated by 1.0 μg/mL tunicamycin (Tm) in the scramble and shCHOP cells. (C) Effects of increasing TR concentrations on shCHOPK562 cells after 24 h of incubation by MTT. Data are expressed as percentages of viable cells (mean ± SD) calculated considering the control (i.e., without TR) as 100%. * Statistically different from shScramble K562 cells (p < 0.05). (D) Expression levels of phosphorylated JNK and other stress-related signaling molecules ERK1/2 and p38 analysis by flow cytometry in K562 cells incubated with TR for 24 h. * Statistically different from the control (p < 0.05).

