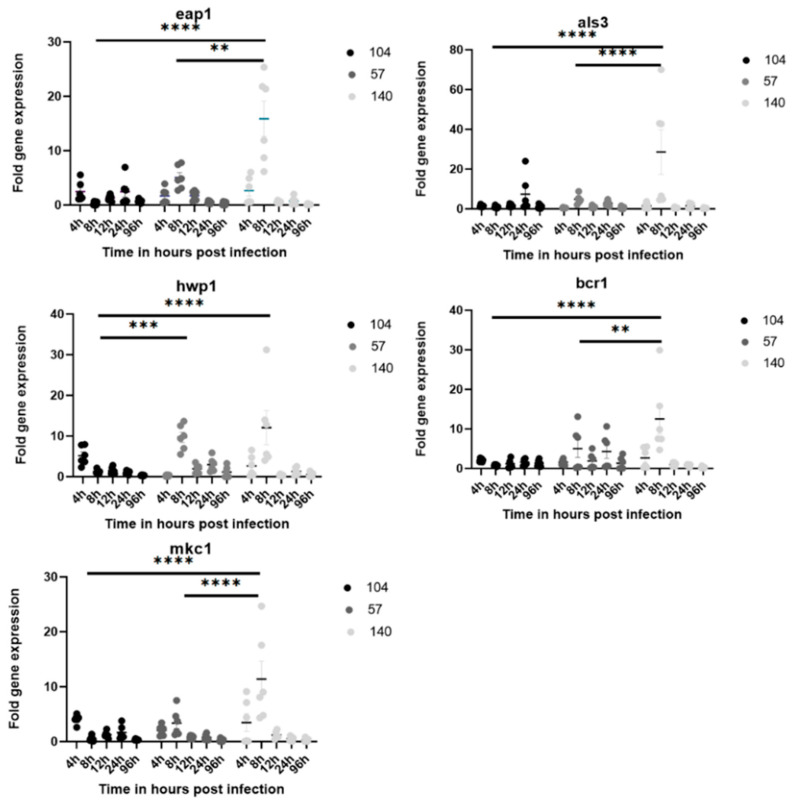
Figure 3.
The expression levels of eap1, als3, hwp1, bcr1, and mkc1 in C. albicans strains 104, 57, and 140 infected zebrafish larvae, by time point. Each experimental group of 30 zebrafish was injected with 0.7 OD yeast cells of one of the C. albicans strains. The normalized ratios of expression were calculated by comparison with the level of expression of the act-1 gene in each group of planktonic cells. Each experiment was performed in duplicate. h, hour; **, p < 0.01; ***, p < 0.001; and ****, p < 0.0001.

