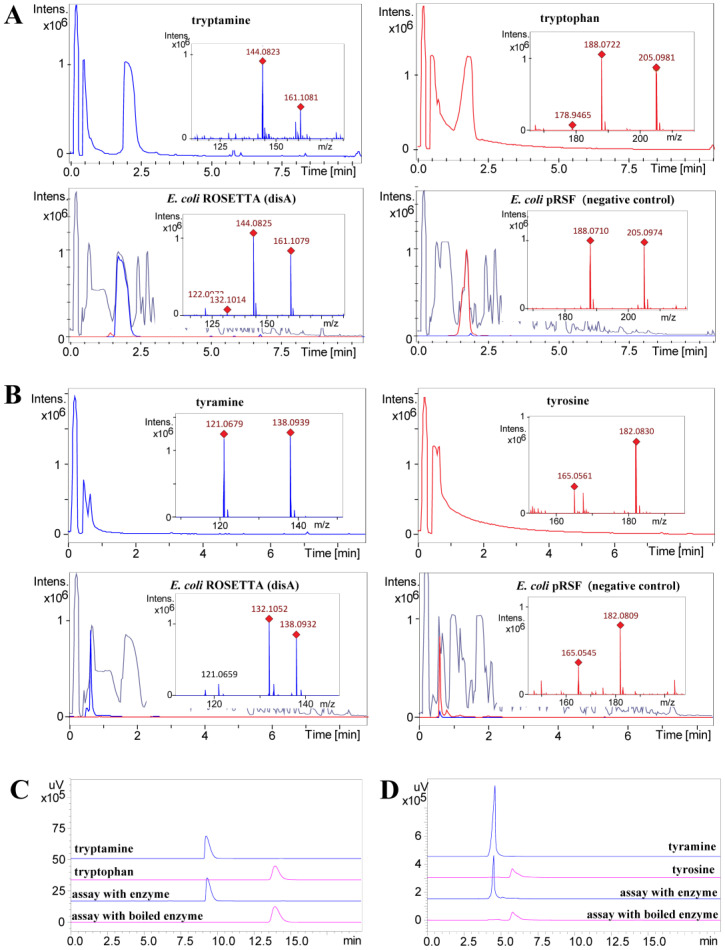
Figure 3.
In vivo and in vitro decarboxylation of tryptophan and tyrosine catalyzed by DisA. (A) In vivo decarboxylation of tryptophan to tryptamine. Extracted ion chromatograms (EICs) of tryptophan (C11H13N2O2 205.0977 [M + H]+, in red) and tryptamine (C10H13N2 161.1079 [M + H]+, in blue). (B) In vivo decarboxylation of tyrosine to tyramine. Extracted ion chromatograms (EIC) of tyrosine (C9H12NO3 182.0817 [M + H]+, in red) and tyramine (C8H12NO 138.0919 [M + H]+, in blue). In A and B, the base peak chromatogram of the extracts is given in grey. (C) Comparative HPLC analysis of the in vitro decarboxylation of tryptophan. (D) Comparative HPLC analysis of the in vitro decarboxylation of tyrosine. In C and D, the UV absorbance at 254 nm is shown.

