Figure 1. Recording descending neuron (DN) population activity and animal behavior.
(a) Schematic of the Drosophila nervous system showing DNs projecting from the brain to motor circuits in the ventral nerve cord (VNC). For clarity, only two pairs of DNs (red and blue) are shown. Indicated (dashed gray line) is the coronal imaging region-of-interest (ROI) in the thoracic cervical connective. (b) In a ‘modulation’ framework for DN population control, new DNs (red) may be recruited to modulate ongoing behaviors primarily driven by core DNs (blue). Each ellipse is an individual DN axon (white, blue, and red). (c) In a ‘context dependence’ framework for DN population control, different DNs may be recruited to drive identical behaviors depending on sensory context. (d) Alternatively, in a ‘sensory encoding’ framework, many DNs may not drive or be active during behaviors but rather transmit raw sensory signals to the VNC. (e) An approach for deriving DN cell identity from population recordings. One may first identify sparse transgenic strains labeling specific neurons from DN populations (circled in black) using their functional attributes/encoding, positions within the cervical connective, and the shapes of their axons. Ultimately, one can use sparse morphological data to find corresponding neurons in the brain and VNC connectomes. (f, g) Template-registered confocal volume z-projections illustrating a ‘brain only’ driver line (otd-nls:FLPo; R57C10-GAL4,tub>GAL80>) expressing (f) a nuclear (histone-sfGFP) or (g) a cytosolic (smGFP) fluorescent reporter. Scale bar is 50 μm. Location of two-photon imaging plane in the thoracic cervical connective is indicated (white dashed lines). Tissues are stained for GFP (green) and neuropil (‘nc82’, magenta). (h) Schematic of the VNC illustrating the coronal (x–z) imaging plane. Dorsal-ventral (‘Dor’) and anterior–posterior (‘Ant’) axes are indicated. (i) Denoised two-photon image of DN axons passing through the thoracic cervical connective. Scale bar is 10 μm. (j) Two-photon imaging data from panel (i) following motion correction and color-coding. An ROI (putative DN axon or closely intermingled axons) is indicated (white dashed circle). (k) Sample normalized time-series traces for 28 (out of 95 total) ROIs recorded from one animal. Behavioral classification at each time point is indicated below and is color-coded as in panel (p). (l) Schematic of system for recording behavior and delivering odors during two-photon imaging (not to scale) while a tethered fly walks on a spherical treadmill. (m) Spherical treadmill ball rotations (fictive walking trajectories) are captured using the front camera and processed using FicTrac software. Overlaid (cyan) is a sample walking trajectory. (n) Video recording of a fly from six camera angles. (o) Multiview camera images are processed using DeepFly3D to calculate 2D poses and then triangulated 3D poses. These 3D poses are further processed to obtain joint angles. (p) Joint angles are input to a dilated temporal convolutional network (DTCN) to classify behaviors including walking, resting, head (eye and antennal) grooming, front leg rubbing, or posterior (abdominal and hindleg) movements.

Figure 1—figure supplement 1. Supporting details regarding neural denoising, driver line expression, odor stimulation, and behavior quantification.
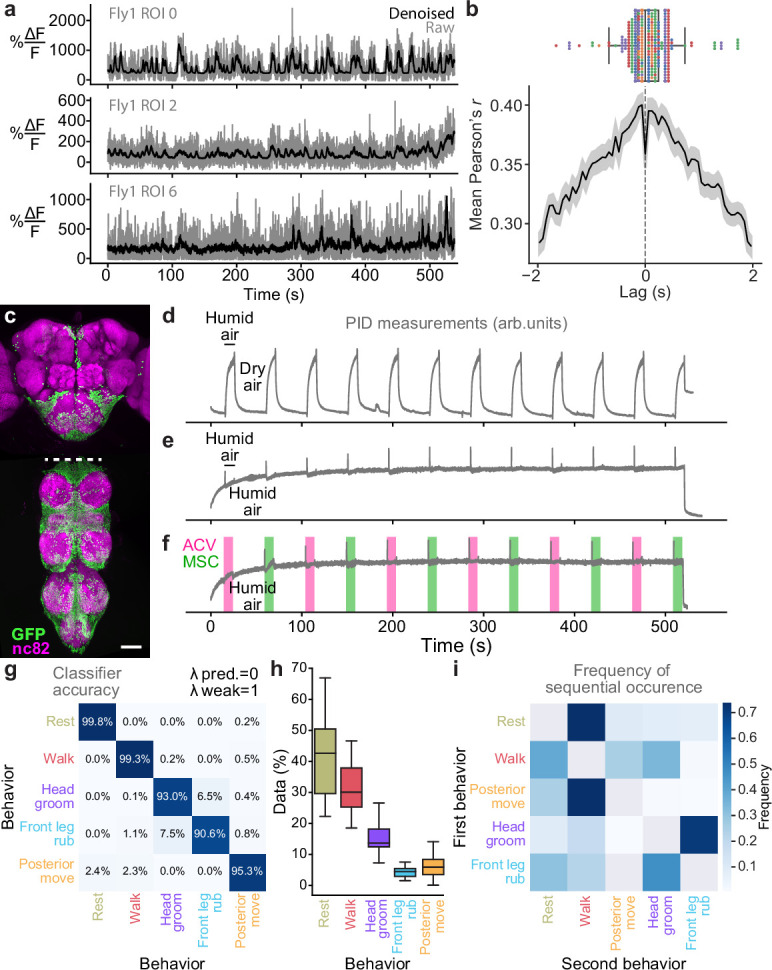
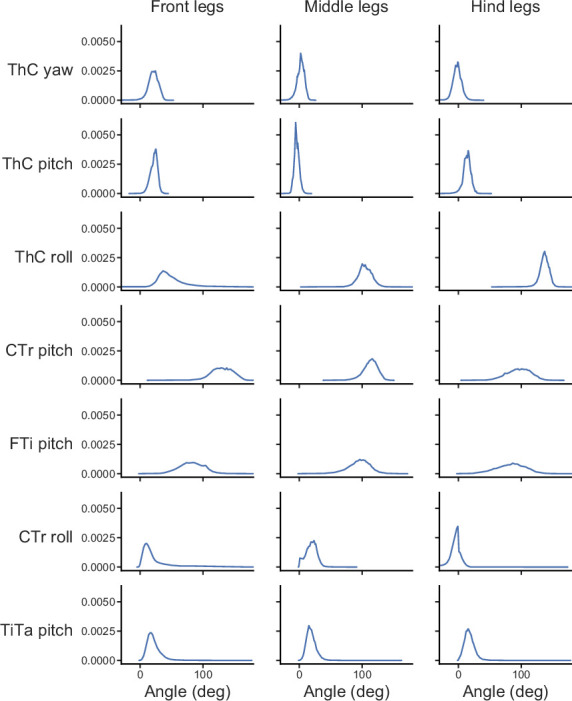
Figure 1—figure supplement 2. The range of joint angles explored during fly behaviors.