. 2022 Oct 26;11:e81527. doi: 10.7554/eLife.81527

Figure 2. Encoding of behavior in descending neuron (DN) populations.

(a) Shown for walking (top) and head grooming (bottom) are the activity (normalized and cross-validation predicted ΔF/F) of individual walk- and head groom-encoding DNs (red and purple lines), as well as predicted ΔF/F traces derived by convolving binary behavior regressors with a calcium response function (crf) (black lines). The output of the behavior classifier is shown (color bar). (b) The cross-validation mean of behavioral variance explained by each of 95 DNs from one animal. Colored asterisks are above the two DNs illustrated in panel (a). (c) The percentage of DNs encoding each classified behavior across five animals. Box plots indicate the median, lower, and upper quartiles. Whiskers signify furthest data points. (d) Mean time projection of GCaMP6s fluorescence over one 9 min recording. Image is inverted for clarity (high mean fluorescence is black). Manually identified DN regions of interest (ROIs) are shown (red rectangles). Scale bar is 10 μm. Panels (d–i) share the same scale. (e) DNs color-coded (as in panel c) by the behavior their activities best explain. Radius scales with the amount of variance explained. Prominent head groom-encoding neurons that are easily identified across animals are indicated (white arrowheads). (f) Behavior-triggered average ΔF/F image for head grooming. Prominent head grooming DNs identified through linear regression in panel (e) are indicated (white arrowheads). (g) Locations of DNs color-coded by the behavior they encode best. Data are from five animals. (h, i) Kernel density estimate based on the locations of (h) walking or (i) head grooming DNs in panel (g). (j) Amount of variance explained by the principal components (PCs) of neural activity derivatives during walking. (k, l) Neural activity data during (k) walking and (l) resting evolve on two lobes. The PC embedding was trained on data taken during walking only. Colored lines indicate individual epochs of (k) walking and (l) resting. Time is color-coded and the temporal progressions of each epoch is indicated (arrowheads). Note that color scales are inverted to match the color at transitions between walking and resting. Black arrows indicate ROIs with high PC loadings. ROI number corresponds to the matrix position in panel (b). For their locations within this fly’s cervical connective, see Figure 2—figure supplement 4d.

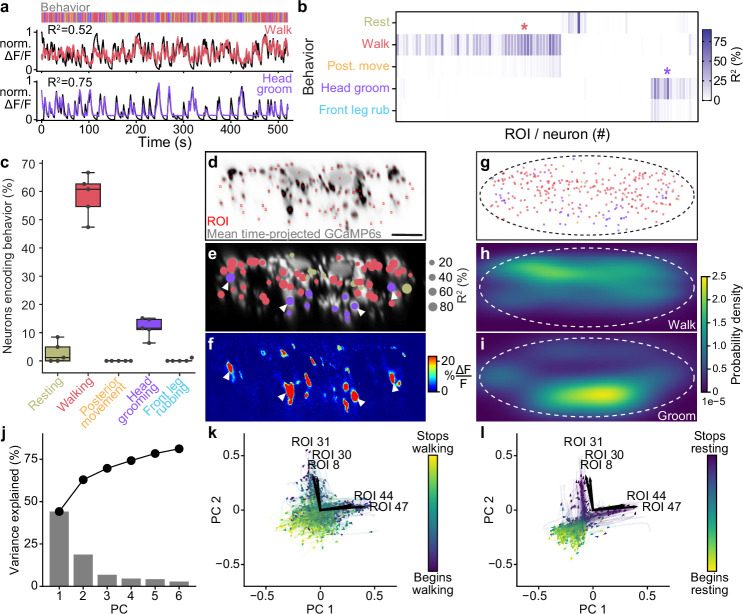
Figure 2.

Figure 2—figure supplement 1. Disentangling the relative encoding of frequently sequential behavior pairs.

Figure 2—figure supplement 1.

(a, b) Cross-validation mean of neural variance uniquely explained by (a) walking versus posterior movements or (b) head grooming versus front leg rubbing. In both cases, only data acquired during the two compared behaviors were analyzed. Additionally, data were balanced to have an equal amount across both behaviors.
Figure 2—figure supplement 2. Encoding of behavior in descending neuron (DN) populations across individual animals.

Figure 2—figure supplement 2.

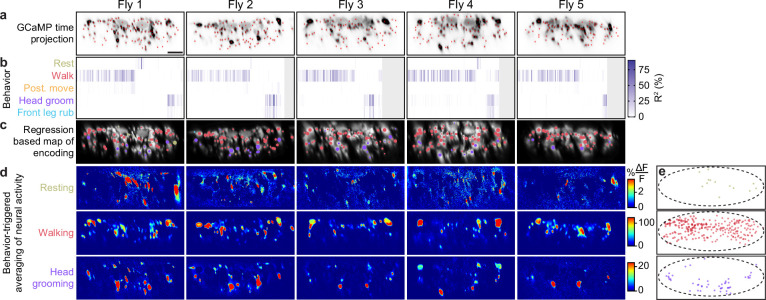
(a) Mean time projections of GCaMP6s fluorescence over a 9 min recording for five animals. Images are inverted for clarity, illustrating high mean fluorescence (black). Manually identified DN regions of interest (ROIs) are shown (red rectangles). Scale bar is 10 μm. All subpanels and panels (c, d) share the same scale. (b) The cross-validation mean of behavioral variance explained by DNs for each animal (Fly 1: n = 95 ROIs; Fly 2: n = 86 ROIs; Fly 3: n = 75 ROIs; Fly 4: n = 81 ROIs; Fly 5: n = 79 ROIs). (c) DNs color-coded by the behavior their activities best explain. Radius scales with the amount of variance explained. (d) Behavior-triggered average ΔF/F images for the most common behaviors—resting, walking, and head grooming. (e) Locations of DNs for the classified behavior they encode best. Data are pooled across five animals.
Figure 2—figure supplement 3. Neural variance explained by distinct kinematic features.

Figure 2—figure supplement 3.

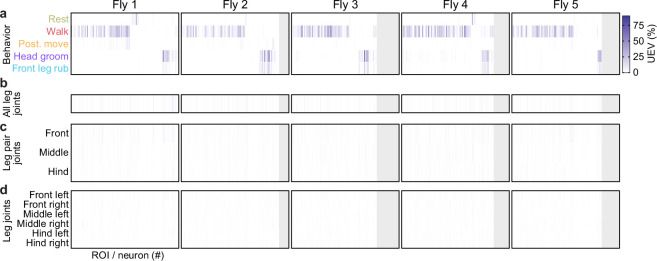
(a–d) Amount of neural variance that can be uniquely explained by (a) classified behaviors (taken from the previous figure), (b) all joint movements, (c) leg pair movements, or (d) individual leg movements.
Figure 2—figure supplement 4. Principal component (PC) analysis of neural activity during walking and resting across individual animals.

Figure 2—figure supplement 4.

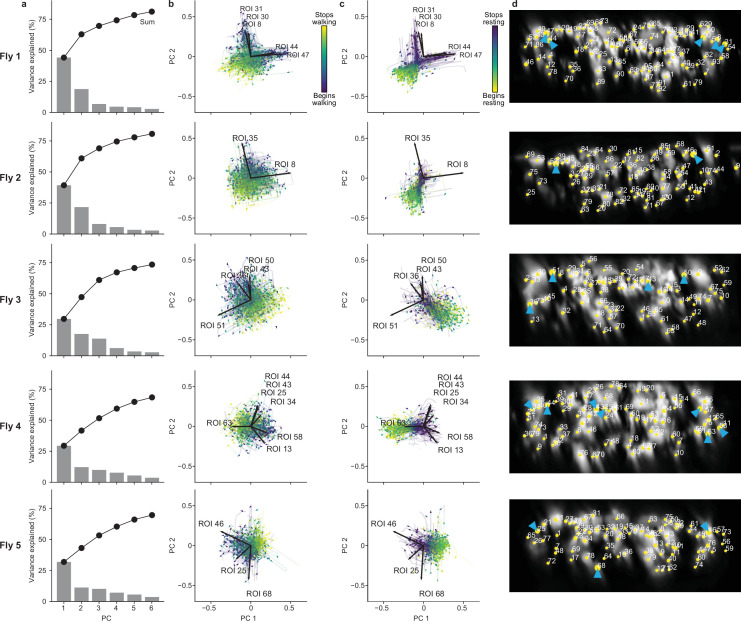
(a) Amount of variance explained by six PCs of neural activity derivatives during walking for five individual flies. (b, c) The derivative of neural activity during (b) walking and (c) resting. PC embeddings were trained on data taken during walking only. Colored trajectories are individual epochs of (b) walking and (c) resting. Time is color-coded and the temporal progression of each epoch is indicated (arrowheads). Note that color scales are inverted to match the color at transitions between walking and resting. Black arrows indicate PC loadings for descending neurons (DNs) with vectors longer than 0.1. Region of interest (ROI) numbers correspond to the connective image in panel (d). (d) Locations of ROIs for each individual animal (yellow circles). Numbers are based on the order in Figure 2—figure supplement 2b. Circle radii indicate the norm of the loadings for PCs 1 and 2 (i.e., the lengths of the vectors in panels b and c). ROIs with the largest loadings are indicated (cyan arrowheads).