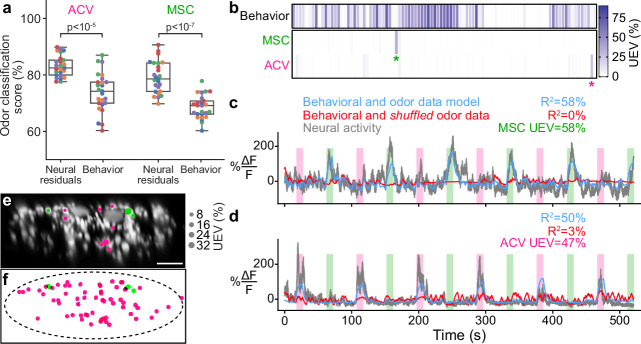
Figure 4. Odor encoding in descending neuron (DN) populations.
(a) Neural residuals—obtained by subtracting convolved behavior regressors from raw neural data—can predict the presence of an odor significantly better than behavior regressors convolved with a calcium response function (‘Behavior’). Two-sided Mann–Whitney U-test. The classification score was obtained using a linear discriminant classifier with cross-validation. Shown are five trials for five animals (color-coded). (b) Matrix showing the cross-validated ridge regression unique explained variance (UEV) of a model that contains behavior and odor regressors for one animal. The first row (‘Behavior’) shows the composite for all behavior regressors with odor regressors shuffled. The second and third rows show the UEVs for regressors of the odors methyl salicylate (MSC) or apple cider vinegar (ACV), respectively. Colored asterisks indicate neurons illustrated in panel (a). (c, d) Example DNs best encoding (c) MSC or (d) ACV, respectively. Overlaid are traces of neural activity (gray), row one in the matrix (blue), and row one with odor data shuffled (red). (e, f) Locations of odor encoding neurons in (e) one individual and (f) across all five animals. Scale bar is 10 μm.


