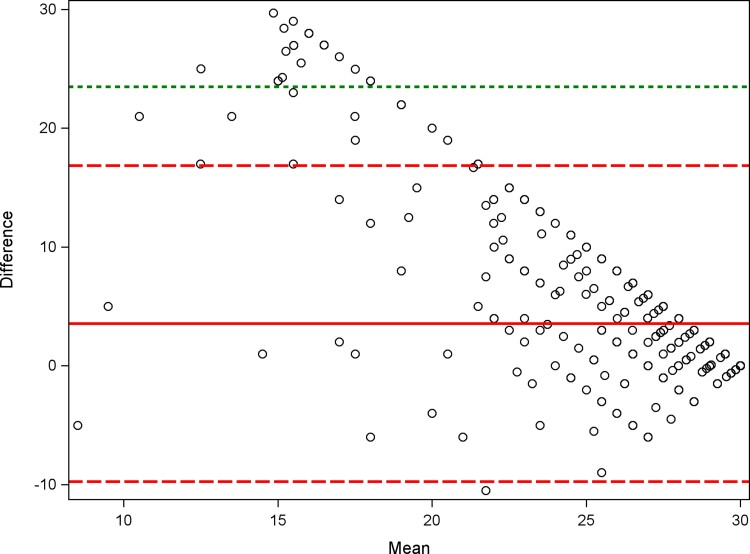
Figure 1.
Bland-Altman plot. Plot of the difference between self-reported adherence and MEMS adherence vs the mean of self-reported adherence and MEMS adherence. Including: a solid reference line for the mean of the difference, a larger dashed reference line for ±2 SDs of the mean of the difference, and a smaller dashed reference line for ±3 SDs of the mean of the difference. Abbreviation: MEMS, medication event monitoring system.

