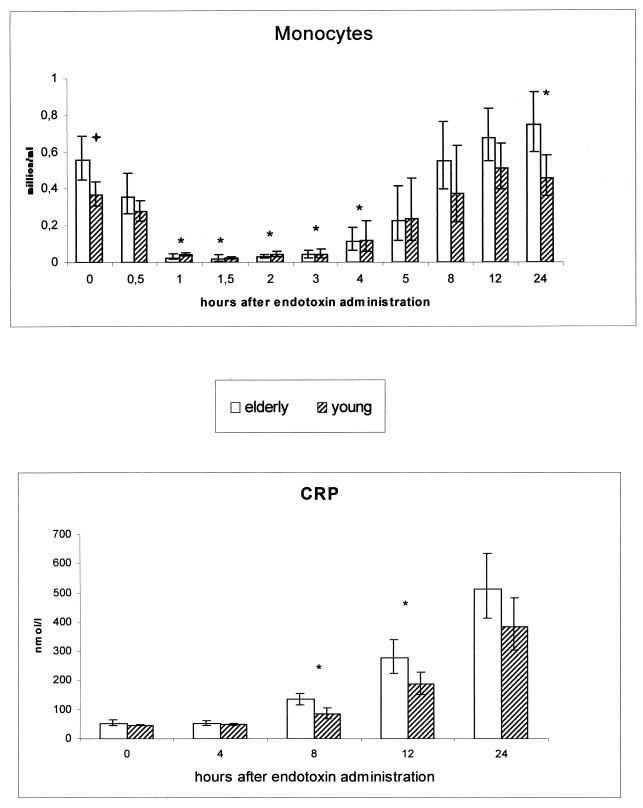
FIG. 3.
Monocyte count and levels of CRP in young versus elderly subjects during human endotoxemia Absolute monocyte concentrations in young (n = 8) versus elderly (n = 9) humans during endotoxemia are shown at the top. Geometric means and 95% confidence intervals are given. Absolute concentrations of CRP in young (n = 8) and elderly (n = 9) subjects are shown at the bottom. Averages and 95% confidence intervals are shown. ∗, significant difference between age groups in the changes from baseline values (p < 0.05);  , difference between groups in baseline value.

