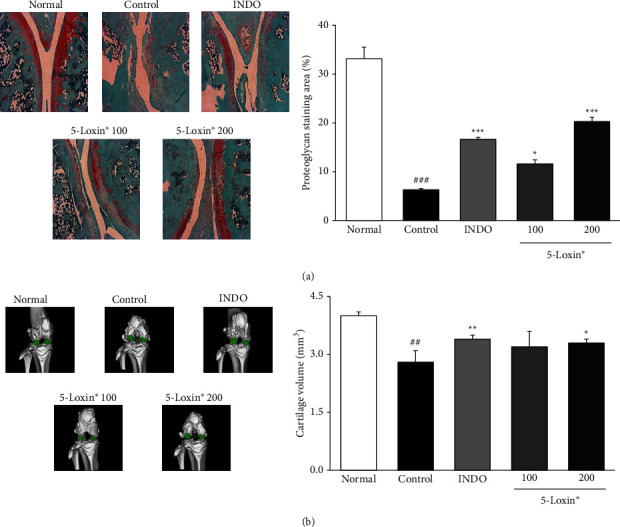
Figure 8.

The representative images and quantitative evaluation of Safranin-O staining (magnification x200) (a) and micro-computed tomography (b) Normal: normal rats; Control: MIA-induced osteoarthritis rats; INDO : MIA-induced osteoarthritis rats administered indomethacin (2 mg/kg body weight); 5-Loxin® 100: MIA-induced osteoarthritis rats administered 5-Loxin® (100 mg/kg body weight); 5-Loxin® 200: MIA-induced osteoarthritis rats administered 5-Loxin® 200 mg/kg body weight. Significance: ##p < 0.01vs. normal rat values and ∗p < 0.05, ∗∗p < 0.01vs. MIA control rat values.
