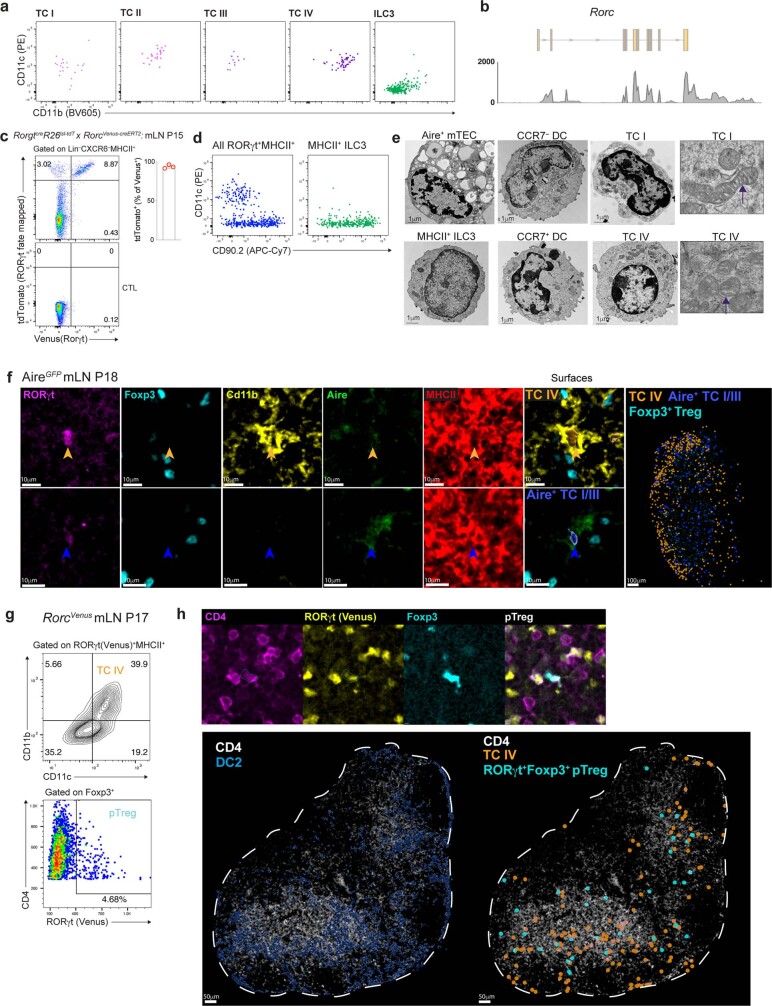
Extended Data Fig. 5. Phenotypic characterization of Thetis cells.
a, Flow cytometry of index sorted mLN RORγt+MHCII+ cells for DC markers, CD11c and CD11b. b, Coverage track for smart-seq2 single cell sequencing reads mapping to the Rorc locus, demonstrating expression of the Rorgt isoform by TCs. c, Flow cytometry of Lin–CXCR6–MHCII+ cells from mLN of RorgtCreR26lsl-tdTomatoRorcVenus-CreERT2 mice and summary graph of frequency of tdTomato+ cells amongst Lin–CXCR6–Venus(YFP)+ cells (n = 3 mice). d, Index sorting flow cytometric analysis of all RORγt+MHCII+ cells (left panel) and cells identified as ILC3 (right panel). e, Electron microscopy of CCR7– DCs, CCR7+ DCs, Aire+ mTECs, TC I, TC IV and MHCII+ ILC3 cells. Far right panel: arrows indicate distinctive mitochondrial cristae in TCs. f, Representative immunofluorescence imaging of TC and Treg markers in mLN sections from 2-week-old AireGFP mice. Arrowheads indicate Aire+ TC I/III or Cd11b+ TC IV. Images are representative of two independent experiments with similar results. g-h, Immunofluorescence analysis of mLN from P17 RorcVenus mice. Representative histo-cytometry plot for identification of RORγt+Foxp3+ pTreg cells and RORγt+MHCII+CD11c+CD11b+ TC IV (g) and representative immunofluorescence imaging demonstrating distribution of indicated cell types (h). n = 3 mice, 2 lymph nodes per mouse. Data in c are representative of 2 independent experiments.

