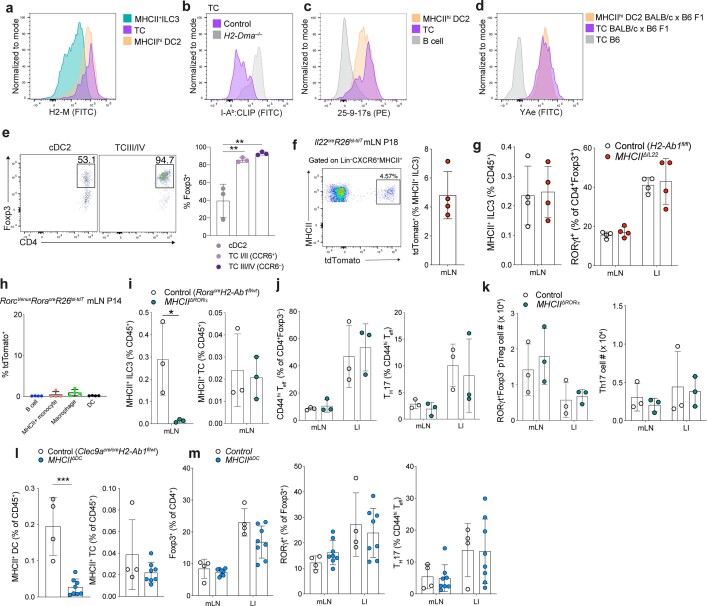
Extended Data Fig. 8. Antigen presentation by ILC3s or dendritic cells is not required for extra-thymic intestinal pTreg differentiation.
a–d, Flow cytometry of mLN from P14 RorcVenus-creERT2 (a,c) or H2-Dma–/– and littermate wild-type mice (b) or BALB/c x B6 F1 RorcVenus-creERT2 mice (d). demonstrating expression of indicated antigen processing and presenting molecules. MHCII+ ILC3s: (Lin–CXCR6+RORγt+MHCII+, TCs: (Lin–CXCR6–RORγt+MHCII+ and DC2s: (Lin–RORγt–CD11c+MHCIIhiCD11b+. Representative of n = 4 mice. e, frequency of Foxp3+ T cells amongst CD4+ T cells following co-culture of naïve CD4+ C7 T cells with indicated TC or DC subset. f, tdTomato labeling in MHCII+ILC3 (Lin–CXCR6+MHCII+) from mLN of IL22 fate-mapping (Il22Cre/+R26lsl-tdtomato) mice at P18. Representative flow cytometry and summary bar graph, n = 4 mice. g, Frequency of MHCII+ ILC3s and RORγt+ pTreg amongst CD4+Foxp3+ cells in indicated tissues from 3-week-old MHCIIΔIL22 (n = 4) and control (H2-Ab1fl/fl) (n = 4) mice. h, tdTomato expression by MHCII+ cell types in mLN of RorcVenusRoracreR26lsl-tdTomato fate-mapped mice at P14; n = 4 mice. i-j, Immune cell composition of 3-week-old MHCIIΔRORα (n = 3) and RoracreH2-Ab1fl/wt (n = 3) mice. (i) Frequency of MHCII+ ILC3s and TCs in mLN. (j), Frequency of CD4+Foxp3–CD44hi Teff and RORγt+ Th17 cells, (k) Total number of RORγt+Foxp3+ pTreg and RORγt+ Th17 cells. l-m, Immune cell composition in mLN of 3-week-old MHCIIΔDC (n = 4) and control (Clec9acreH2-Ab1fl/wt) (n = 8) mice from 2 independent experiments. Frequency of MHCII expressing DCs or TCs within mLN (l). Frequency of total Foxp3+ Treg cells, pTreg cells amongst CD4+Foxp3+ cells, and Th17 cells in mLN and LI (m). Data in a-k are representative of 2-3 independent experiments, data in l,m are pooled from 2 independent experiments. Error bars: means ± s.e.m. ***P < 0.01, ****P < 0.0001; unpaired two-sided t-test.

