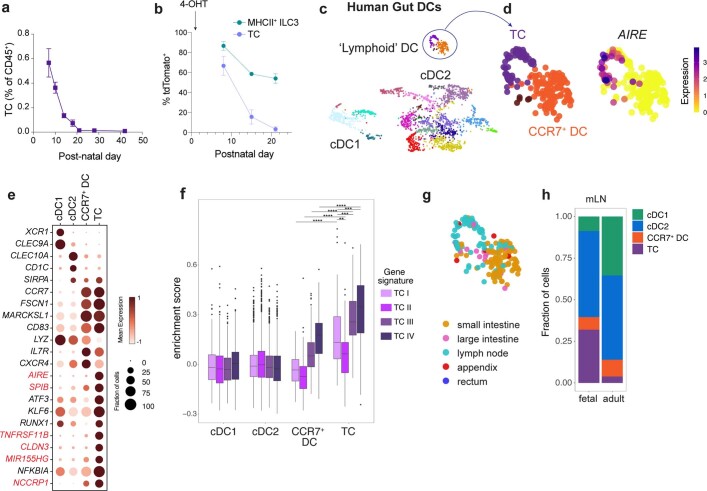
Extended Data Fig. 9. Thetis cells are enriched in early life and conserved across mouse and human.
a, Frequency of TCs within mLN from postnatal day 7 to 6-weeks-of age (n = 3–8 mice per timepoint). b, Percentage of tdTomato+ TCs and MHCII+ ILC3s isolated from mLN of RorcVenus-creERT2R26lsl-tdTomatoAireGFP mice at indicated time intervals following administration of 4-OHT on P1 (n = 4 mice per timepoint). c, Human gut atlas single cell transcriptomes. Cells annotated as DCs were reclustered with PhenoGraph and visualized with UMAP. d, UMAP of ‘lymphoid’ DC clusters colored by PhenoGraph cluster or unimputed expression of AIRE. e, Dot plot showing select genes differentially expressed between indicated cell subsets. f, Enrichment of TC subset signature genes within indicated human APC subsets. g, UMAP colored by tissue of origin. h, Proportion of indicated DC/TC subsets within mLN samples in fetal vs adult samples. Clusters annotated as cDC2 or cDC1 were grouped for analysis. Data in b are representative of two independent experiments. Box plots (f) indicate the median (center lines) and interquartile range (hinges), and whiskers represent min and max, dots represent outliers. ****P < 0.0001, ***P < 0.001, **P < 0.01; Mann Whitney U test (f).

