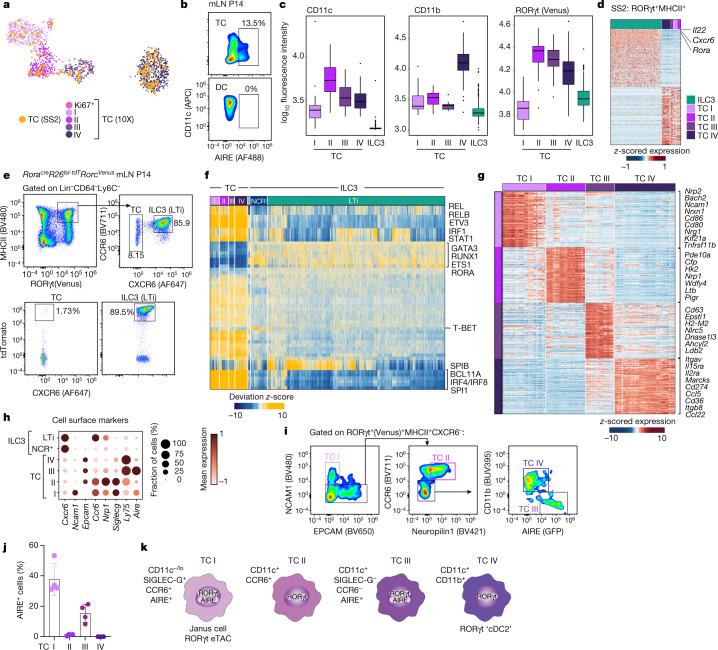
Fig. 3. Transcriptional, epigenetic and ontological features of Thetis cell subsets.
a, UMAP visualization of integrated 10X Genomics and Smart-seq2 (SS2) scRNA-seq analysis for RORγt+MHCII+ Thetis cells (TC), coloured by SMART-seq2 Thetis cell transcriptome or 10X cluster annotation. b, Intracellular expression of AIRE protein by Thetis cells and dendritic cells. c, Index-sorting summary graphs for CD11c, CD11b cell-surface protein and RORγt (Venus) fluorescence intensity. d, Heat map showing expression of top differentially expressed genes (DEGs) between Thetis cells and MHCII+ ILC3s, profiled by SMART-seq2, identifying Rora as an ILC3–Thetis cell-distinguishing gene. e, Representative flow cytometry analysis of tdTomato expression in MHCII+ILC3 and Thetis cells isolated from mLN of RorcVenusRoracreRosa26lsl-tdTomato fate-mapped mice at P14 (n = 4). f, Heat map reporting scaled chromVAR deviation transcription factor motif scores (left) and corresponding transcription factor gene expression values (right) for top transcription factor gene–motif pairs in Thetis cells in scATAC-seq data. g, Heat map showing scaled, imputed expression of top 125 DEGs (one versus the rest, fold change (FC) > 1.5, adjusted P < 0.01) for each Thetis cell cluster. h, Dot plot showing expression of selected cell-surface markers that are differentially expressed between Thetis cell subsets. i, Gating strategy for identification of Thetis cell subsets. j, Intracellular expression of AIRE protein by Thetis cell subsets; each symbol represents an individual mouse (n = 4). k, summary of TC I–TC IV phenotypes. Plots in i are representative of n = 6 mice from 3 independent experiments. Data in b,e,j are representative of 3 independent experiments. Box plots in c indicate median (centre line) and interquartile range (hinges), whiskers represent minimum and maximum values, and dots represent outliers.

