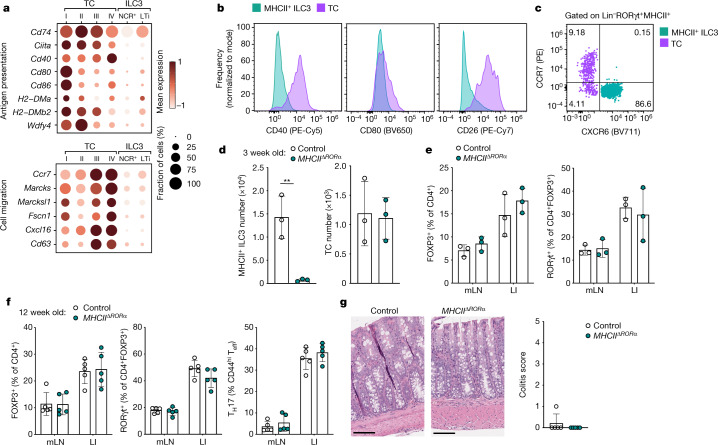
Fig. 4. Antigen presentation by ILC3s is not required for intestinal pTreg differentiation.
a, Dot plot showing expression of genes related to antigen presentation, T cell priming and cell migration across Thetis cell and MHCII+ ILC3 clusters (Fig. 2b). b, Representative flow cytometry of mLN ILC3s (CXCR6+RORγt+MHCII+) and Thetis cells (CXCR6–RORγt+MHCII+) from P18 RorcVenus-creERT2AireGFP mice (n = 3), showing expression of indicated chemokine receptors, co-stimulatory and immune-regulatory molecules. d,e, Immune cell composition of 3-week-old MHCIIΔRORα (n = 3) and RoracreH2-Ab1fl/wt (n = 3) mice. d, Number of MHCII+ ILC3s and Thetis cells in mLN. e, Frequency of total Treg (FOXP3+) and RORγt+ pTreg cells. f, Frequency of total Treg (FOXP3+), RORγt+ pTreg cells and TH17 cells in mLN and large intestine lamina propria (LI) of 12-week-old MHCIIΔRORα (n = 5) and RoracreH2-Ab1fl/wt (n = 5) mice. g, Representative histological analysis of H&E-stained sections of the colon of mice in f (left) and summary histological colitis score (right). Scale bars, 200 μm. Data in b–f are representative of two or three independent experiments. Data are mean ± s.e.m. Each symbol represents an individual mouse. Two-tailed unpaired t-test.

