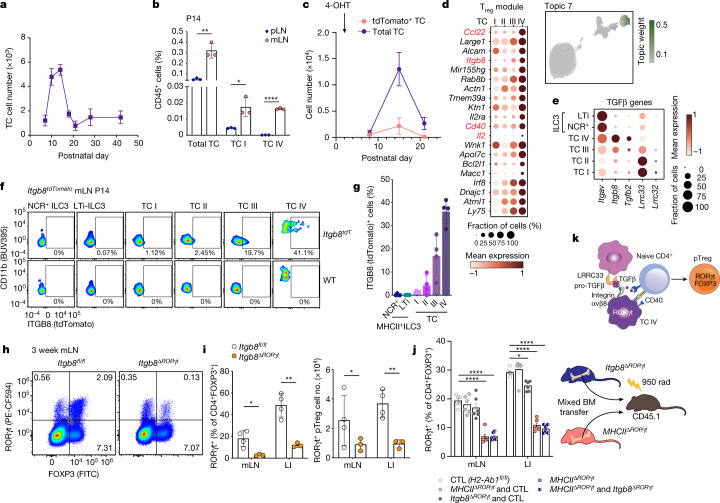
Fig. 5. A developmental wave of Thetis cells promotes early life pTreg differentiation in an ITGB8-dependent manner.
a, Number of Thetis cells in mLN from P7 to week 6 (n = 3–8 individual mice per timepoint). b, Frequency of Thetis cells in pLN and mLN of RorcVenus-creERT2AireGFP mice at P14 (n = 3 mice per group). c, Total number of tdTomato– and tdTomato+ Thetis cells isolated from mLN of RorcVenus-creERT2Rosa26lsl-tdTomatoAireGFP mice at indicated time intervals following administration of 4-OHT at P1 (n = 4 mice per timepoint). d, Topic modelling of 10X scRNA-seq Thetis cell transcriptomes. The UMAP is coloured by the weight of topic 7 in each cell. e, Dot plot showing the expression of TGFβ pathway genes in Thetis cells and ILC3s. f,g, Representative flow cytometry (f) and summary graphs (g) of ITGB8 (tdTomato) expression in Thetis cell and ILC3 subsets in mLN of Itgb8tdTomato (n = 4) or littermate wild-type (WT) mice. h,i, Representative flow cytometry of RORγt- and FOXP3-expressing T cell subsets (h) and summary graphs for frequencies and numbers (i) of pTreg (RORγt+FOXP3+) cells in mLN and large intestine lamina propria (LI) of 3-week-old Itgb8ΔRORγt (n = 3) and Itgb8fl/fl (n = 4) mice. j, Frequency of RORγt+ pTreg cells among CD4+FOXP3+ cells in mLN and large intestine lamina propria of mixed bone marrow (BM) chimeras, analysed 6 weeks after reconstitution (n = 6 mice per group). k, Schematic of pTreg induction by Thetis cells. Data in b,c are representative of two independent experiments. Data in f,g,j are pooled from two (j) or three (f,g) independent experiments. Data in h,i are representative of 4 independent experiments. Data are mean ± s.e.m. Two-tailed unpaired t-test.

