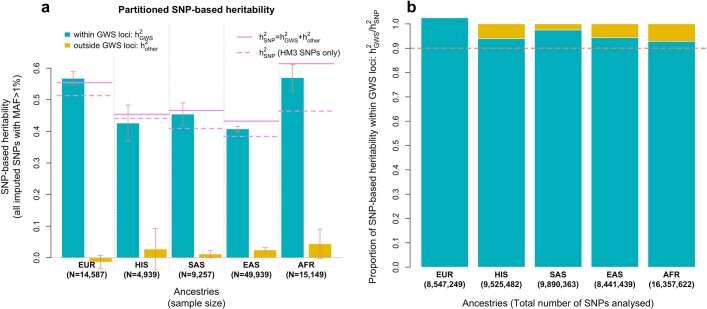
Extended Data Fig. 6. Variance of height explained by common SNPs within 35 kb of GWS SNPs.
Stratified SNP-based heritability () estimates were obtained from a partition of the genome into two sets of 1000 Genomes imputed SNPs with a minor allele frequency (MAF) >1%: (1) SNPs within +/− 35 kb of GWS (GWS loci) vs. all other SNPs. Analyses were performed in samples of five different ancestry groups: European (EUR; UK Biobank only), African (AFR), East Asian (EAS) and South Asian (SAS) as described in the legend of Fig. 3. Estimates from stratified analyses were compared with SNP-based heritability estimates obtained from analysing HM3 SNPs only (dotted horizontal violet bar).

