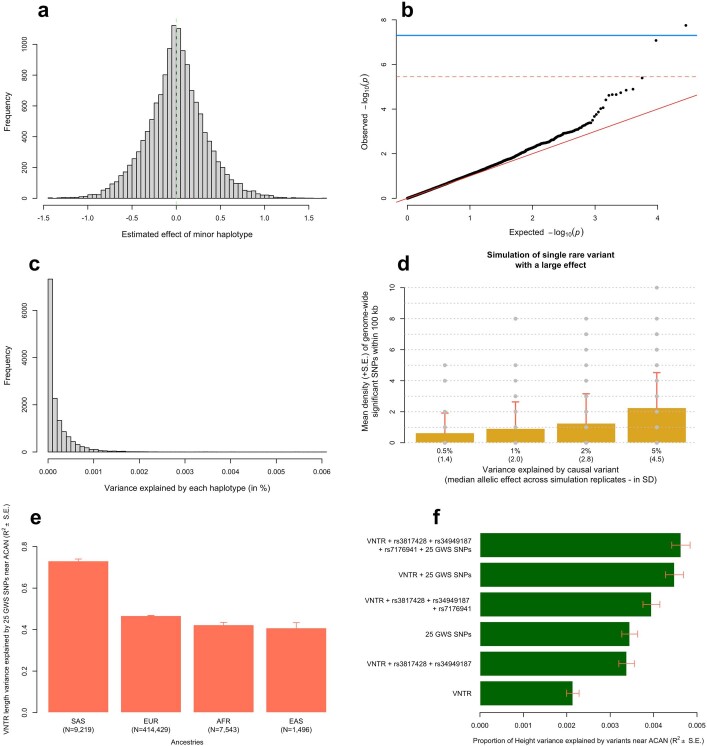
Extended Data Fig. 5. Haplotypic analysis at the ACAN locus.
a, Distribution of estimated haplotype effects from 14,117 haplotypes covering a 100 kb long genomic region near the ACAN gene (hg19 genomic coordinates: chr15:89,307,521-89,407,521). b, Quantile-quantile plot of associations between these 14,117 haplotypes and height. c, Distribution of the variance explained by each of the 14,117 haplotypes. d, Mean signals density (y-axis) across simulated data where 1 causal SNP within the locus explains between 0.5% and 5% (x-axis) of trait variance. Causal variants were sampled from a pool of 13 SNPs with a 1.4×10⁻⁵ < MAF < 1% genotyped in 291,683 unrelated EUR participants of the UKB, with no missing values at these 13 SNPs. Standard errors were calculated as the standard deviation (s.d.) of signal density across 100 simulation replicates. GCTA-COJO analyses to identify independent signals were performed using a subset of 10,000 unrelated EUR participants of the UKB to mimic the large discrepancy between the size of the discovery GWAS and that of the LD reference used in our real data analyses. e, Proportion of VNTR length explained by 25 GWS SNPs identified near ACAN in 4 ancestries (European: EUR; South Asian: SAS; East Asian: EAS; African: AFR). f, Proportion of height variance explained in a sample of EUR UK Biobank participants by various sets of polymorphisms at the ACAN locus. rs3817428 and rs34949187 are two missense variants and rs7176941 is an intronic variant with high posterior causal probability identified in ref. 28. In e and f, error bars represent standard error (s.e.).

