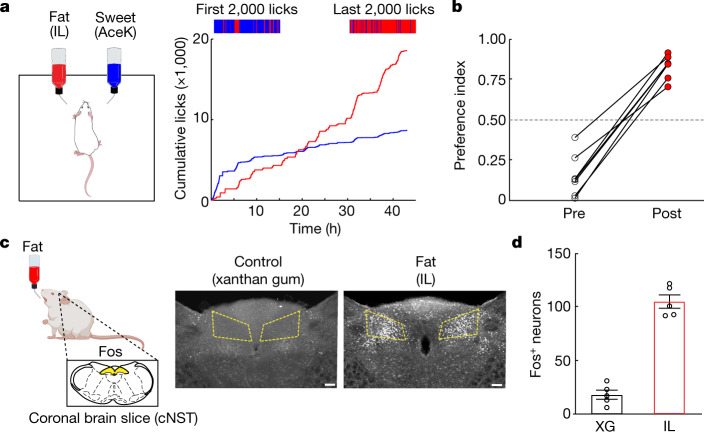
Fig. 1. The development of fat preference.
a, Left, cartoon illustrating the behavioural arena; mice were allowed to choose between a fat emulsion (1.5% Intralipid (IL)) and an artificial sweetener (3 mM AceK). Preference was tracked by electronic lick counters in each port. Right, cumulative licks for each bottle over the 48 h session. The colour bars at the top show lick rasters for fat (red) and sweet (blue) from the first and last 2,000 licks of the behavioural test. Note that by 24 h the mice begin to drink almost exclusively from the fat bottle (red trace). b, Preference plots for fat versus sweet. In these experiments, mice began the preference test preferring sweet (preference index < 0.5), but in all cases they switched their preference to fat (n = 7 mice, two-tailed paired t-test, P = 1.9 × 10⁻⁵) The dashed line indicates the equal preference level (50%). c, Schematic showing stimulation of Fos induction by fat ingestion. Strong Fos labelling is observed in the cNST (highlighted yellow) upon ingestion of 20% IL but not by the control stimulus (0.3% xanthan gum (XG)). Scale bars, 100 µm. d, Quantification of Fos-positive neurons. The equivalent area of the cNST (200 µm × 200 µm; bregma −7.5 mm) was processed, and positive neurons were counted for the different stimuli. Two-sided Mann–Whitney U-test between XG and IL (n = 5 mice), P = 7.9 × 10⁻³. Data are mean ± s.e.m.

