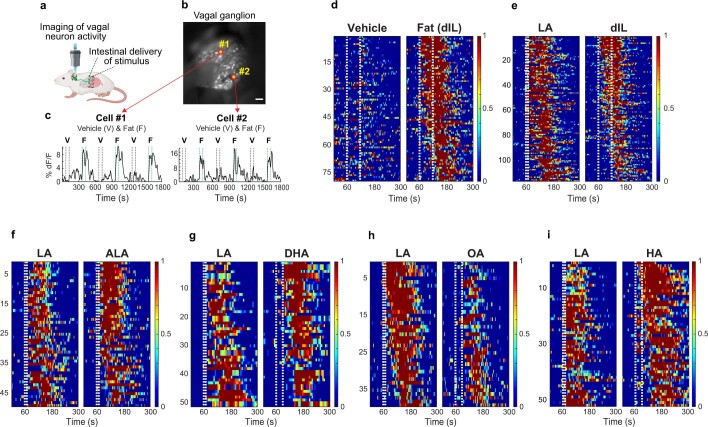
Extended Data Fig. 4. Various dietary fatty acids activate vagal neurons.
a-b, Schematic of vagal calcium imaging while simultaneously delivering stimuli into the intestines (see Methods for details). The picture shows a representative view of a vagal nodose ganglion of Vglut-Cre; Ai96 in an imaging session. Two fat responders (denoted #1 and #2) are highlighted, and their responses shown in panel c. c, Sample traces of vagal responses to intestinal stimulation with alternating pulses of vehicle or fat (pre-digested IL; see Methods for details). Note time-locked, reliable responses to fat, but not to vehicle control. Stimulus window (60 s) is marked by dotted white lines. Note that since IL is a complex mix, it must be pre-digested in vitro by incubation with lipases prior to using in imaging experiments (versus ingestion, where endogenous lipases in the stomach naturally digest IL). d, Heat maps depict z-score-normalized fluorescence traces from vagal neurons that responded to pre-digested (dIL, n = 79/463 neurons from 8 ganglia). Each row represents the average activity of a single cell to three trials. Stimulus window is shown by dotted white lines. e–i, Responses of vagal neurons to intestinal delivery of a range of fatty acids. e, Heat maps show z-score-normalized fluorescence traces of vagal neurons to intestinal delivery of 10% LA (10 s) and digested Intralipid (dIL); n = 116/634 neurons from 7 ganglia; note that the same neurons responded to both stimuli. f, 10% LA (10 s) and 10% alpha-linolenic acid (ALA), n = 49/322 neurons from 3 ganglia; g, 10% LA (10 s) and 10% docosahexaenoic acid (DHA), n = 51/348 neurons from 5 ganglia; h, 10% LA (10 s) and 10% oleic acid (OA), n = 39/418 neurons from 6 ganglia; i, 10% LA (10 s) and 10% hexanoic acid (HA), n = 52/495 neurons from 6 ganglia.

