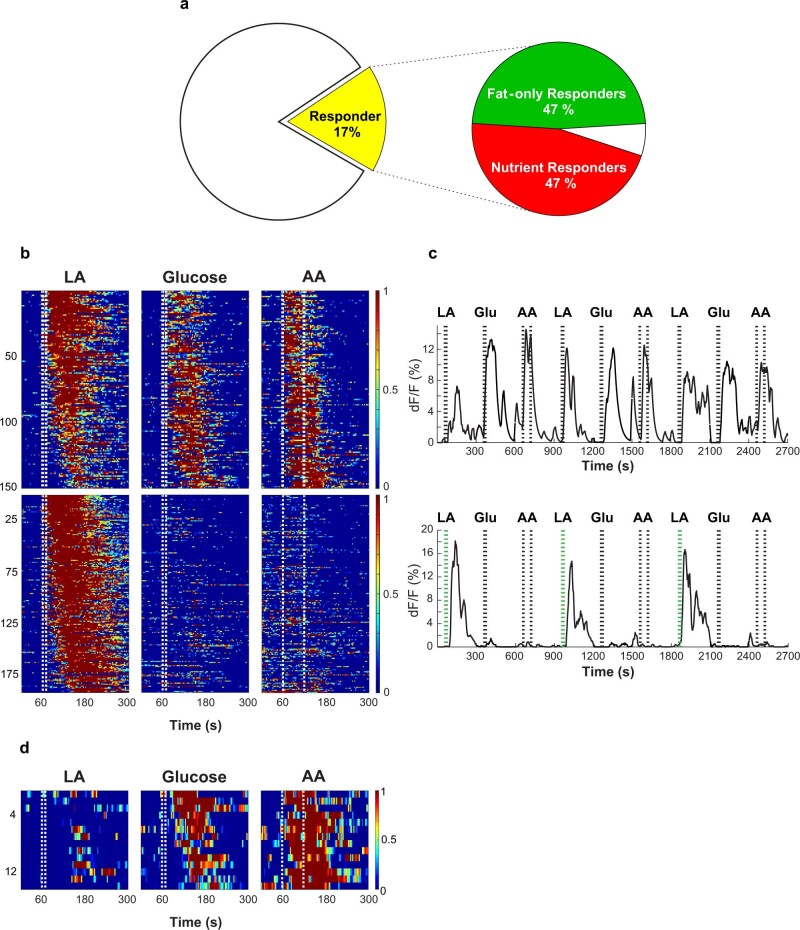
Extended Data Fig. 5. Distinct populations of vagal neurons respond to intestinal delivery of nutrients and fat.
a, Pie chart illustrating the fraction of fat and sugar responders in the nodose ganglia of Vglut2-GCaMP6s animals. The data is from 1813 neurons from 22 ganglia (red, n = 323 cells, 17%). Right, within the responding neurons, 151 (47%) responded to both sugar and fat (“nutrient responders”), while 153 (47%) responded only to fat but not to sugar stimuli (“fat-only responders”). b, Sugar/nutrient versus fat-only vagal neurons: Heat maps depicting z-score-normalized vagal responses to intestinal delivery of fat (10% linoleic acid, LA), sugar (500 mM glucose) and amino acids (250 mM amino acid mixture, AA; see Methods). Each row represents the average activity of a single cell to 3 trials. Stimulus window is shown by dotted white lines. Upper panels show 150 neurons that responded to intestinal application of sugar, fat and amino acids (“sugar/nutrient responders”); bottom panels show 192 neurons that responded only to fat. n = 22 ganglia, 1884 imaged neurons. c, Representative traces from a “sugar/nutrient responder” (top) and a “fat-only responder” (bottom). Shown are responses to intestinal stimulation with 9 interleaved pulses of fat (10% LA, 10 s, green dotted line), sugar (500 mM Glu, 10 s) and amino acids (250 mM AA, 60 s). d, Heat maps of the small subset of vagal neurons that responded to sugar and amino acids but not to fat (n = 14/1884 neurons from 22 nodose ganglia). On average, less than 1 neuron was detected per ganglia. We note that when using high concentrations of glucose stimuli (>250 mM) for long stimulation times (60 s) one can detect strong vagal responses, but these have been shown not to be sugar-preference responses4,22.

