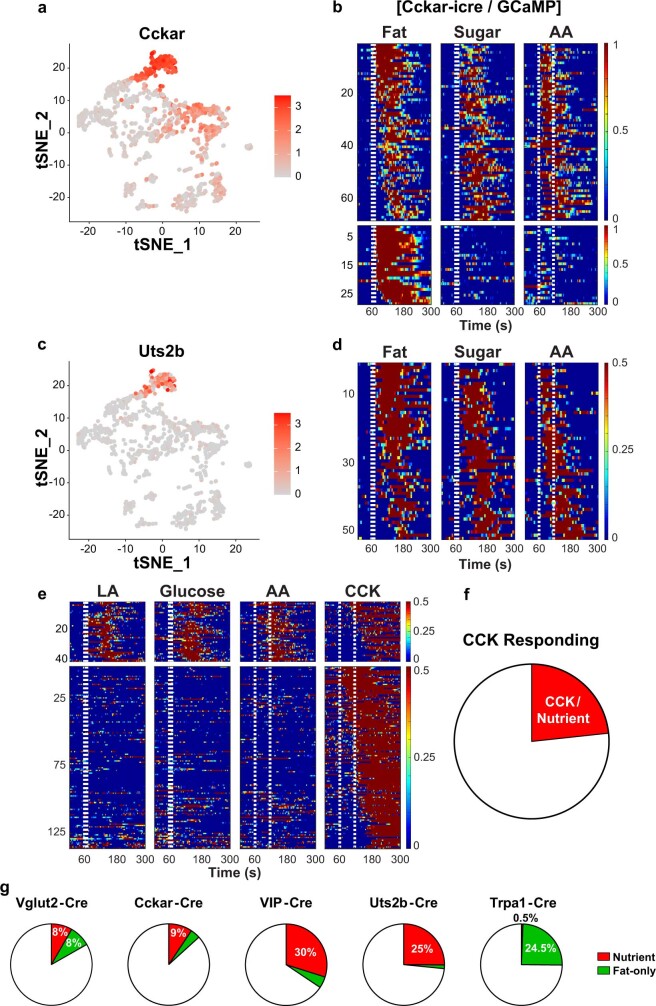
Extended Data Fig. 7. Sugar/fat/amino acid sensing vagal neurons.
a, Shown is a tSNE plot of the transcriptome of mouse vagal nodose neurons (original data set taken from reference37); CCKAR expression is represented on a grey-to-red scale. b, CCKAR-expressing neurons respond to intestinal stimulation with nutrients. An engineered Cckar-iCre was used to drive GCaMP6s expression in CCKAR vagal neurons (see Methods). We analysed 724 imaged neurons from 12 ganglia. Shown are heat maps depicting z-score-normalized fluorescence traces of the CCKAR-expressing neurons responding to intestinal delivery of fat (10 % linoleic acid), sugar (500 mM glucose) or amino acids (250 mM amino acid mixture). Stimulus window is shown by dotted white lines. c-d, tSNE plot of the transcriptome of mouse vagal nodose neurons; urotensin 2B (Uts2b) expression is represented on a grey-to-red scale. d, Shown are responses of vagal Uts2b-expressing neurons (Uts2b-GCaMP6s) to intestinal delivery of fat (10 % linoleic acid), sugar (500 mM glucose) or amino acids (250 mM amino acid mixture). The heat maps depict z-score-normalised fluorescence traces of sugar/nutrient responders (n = 52/207 neurons from 7 ganglia). Stimulus window is shown by dotted white lines. Note that only 3 of the 52 neurons responded only to fat (shown at the top of the heat maps). e, Sugar/nutrient responders are a unique subset of CCKAR-expressing vagal neurons. Heat maps showing z-score-normalized fluorescence traces from vagal neurons that respond to CCK and nutrient stimuli (see Extended Data Fig. 6f). While all of the neurons that responded to intestinal stimulation with sugar, fat and amino acids (i.e. the sugar/nutrient sensors) also responded to CCK, the vast majority of vagal neurons that respond to CCK do not respond to nutrient stimuli (bottom heat maps, n = 136 neurons). This is expected since only a small fraction would be mediating sugar/nutrient preference, versus other roles of CCK signaling31–33. Stimuli: 10% linoleic acid (LA), 10 s; 500 mM glucose, 10 s; 250 mM amino acids (AA), 60 s; 1 μg/ml CCK, 60 s. f, the pie chart is based on data from 12 ganglia. Since vagal neurons that only respond to fat stimuli are not activated by CCK, they are not part of this analysis (see Extended Data Fig. 6f, bottom panels). g, Pie charts depicting the fraction of sugar/nutrient (red) and fat-only (green) responders in animals driving GCaMP6s reporter from various driver lines: Vglut2-Cre, Cckar-Cre, Vip-Cre, Uts2b-Cre, and Trpa1-Cre animals. VIP/Uts2b define the sugar/nutrient responders while TrpA1 mark the fat-only responders.

