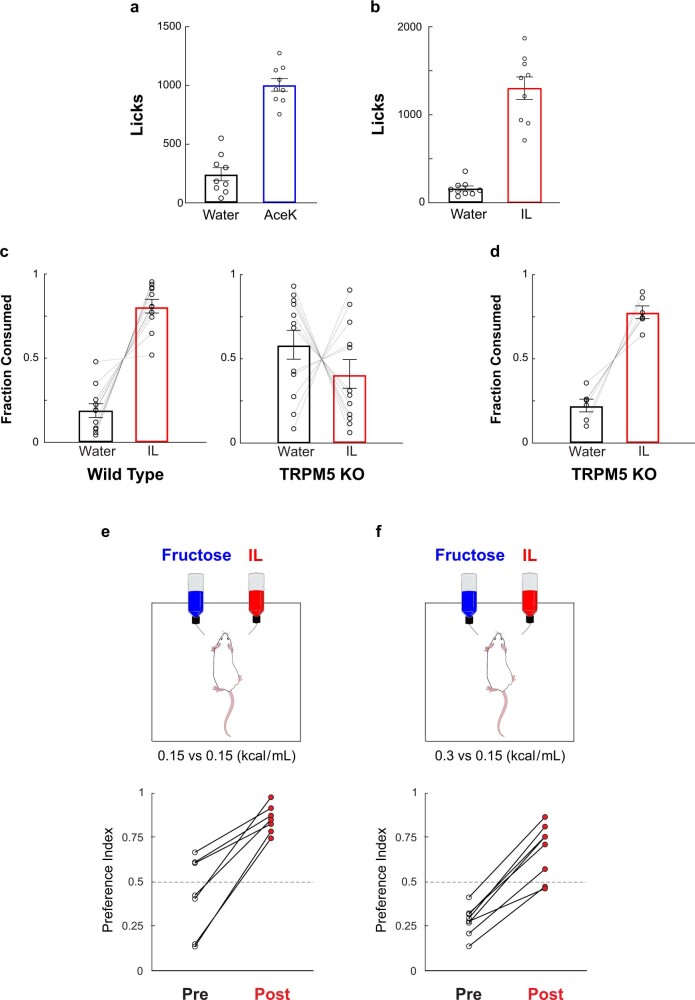
Extended Data Fig. 1. Development of post-ingestive fat preference is independent of immediate attraction to fat and caloric content.
a, b, Immediate attraction to sweet and fat. Graphs of lick counts from brief-access (30 min) two-bottle tests. a, Artificial sweetener (3 mM AceK) versus water, n = 9 mice, two-tailed paired t-test, P = 2x10⁻⁶; b, Fat (1.5% Intralipid, IL) versus water, n = 9 mice, two-tailed paired t-test, P = 2x10⁻⁵. Values are mean ± s.e.m. Note strong innate attraction to sweet and fat stimuli. c, Immediate attraction to fat is abolished in TRPM5 knock-out animals. Shown are results from 30 min two-bottle test of fat (1.5% Intralipid, IL) versus water in wild type mice (left panel, n = 11 mice) versus TRPM5 knockout mice (right panel, n = 12 mice). TRPM5 knock-out animals are blind to the taste of fat3. Two-sided Mann–Whitney U-test wild type versus TRPM5 knockout fat consumption: P = 1.6x10⁻³. Note that there is no innate attraction to either bottle, with the animals randomly choosing to consume from either one. d, In contrast, in a 48 h two-bottle fat preference test, TRPM5 KO animals still developed strong post-ingestive preference to fat (n = 6 mice, two-tailed paired t-test, P = 7.4x10⁻⁴). e, Development of fat preference is independent of caloric content. To test the effect of calories, we examined preference between a caloric sugar (fructose) versus fat. Importantly, we used a sugar (fructose) that does not activate SGLT1, and therefore does not trigger post-ingestive preference4, thus we can isolate the effect of calories without the confound of having two preference-triggering stimuli (i.e. glucose versus fat). Cartoon on the top illustrates the behavioral arena; mice were allowed to choose between fructose (0.15 kcal/ml) and fat (IL at 0.15 kcal/ml). f, Similar test, but fructose at twice (0.3 kcal/ml) the caloric content of IL. By the end of the 48 h preference test, all the mice switched their preference for fat. e, paired t-test, P = 8x10⁻⁴, n = 7; f, paired t-test, P = 1x10⁻⁵, n = 7. Note that while at the higher fructose concentration (panel f) all of the animals began the test with much stronger attraction to the (sweeter) fructose bottle, all still switched their preference to fat, independent of caloric content.

