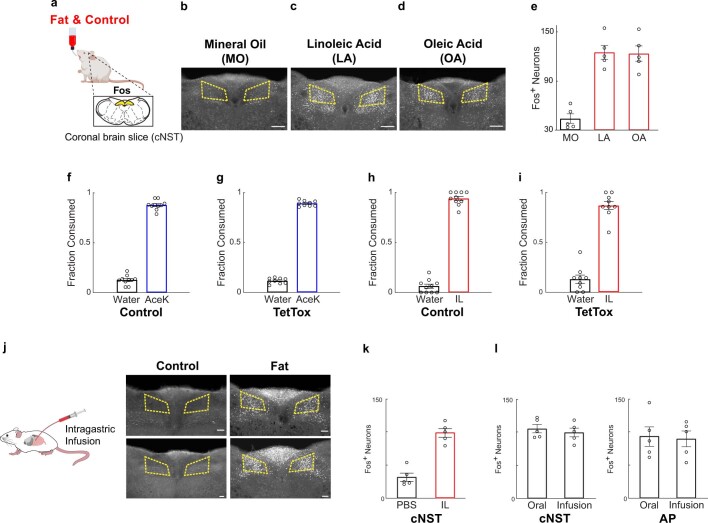
Extended Data Fig. 2. Fat activates cNST neurons.
a–d, Strong Fos labelling is observed in neurons of the cNST (Bregma −7.5 mm) in response to ingestion of fat stimuli (panels c-d), but not in control animals (10% mineral oil, panel b). Stimulus: 10% linoleic acid (LA), 10% oleic acid (OA). Scale bars, 200 µm. e, Quantification of Fos-positive neurons. ANOVA with Tukey’s HSD test against mineral oil (MO, n = 5 mice): P = 3.4x10⁻⁵ for linoleic acid (LA, n = 5 mice), P = 3.9x10⁻⁵ for oleic acid (OA, n = 5 mice). Values are mean ± s.e.m. f–i, TetTox silencing of fat-TRAP cNST neurons does not impair immediate attraction to sweet (3 mM AceK; f, g) or fat (1.5% IL; h, i). Two-tailed paired t-tests: sweet versus water, wild type, n = 10, P = 1.1x10⁻⁷; TetTox n = 9, P = 1.1x10⁻⁶. For fat versus water, wild type, n = 10, P = 6.8x10⁻⁵; TetTox, n = 9, P = 1.7x10⁻⁵. Values are mean ± s.e.m. j-k, Intragastric infusion with fat activates cNST neurons. j, Direct intragastric infusion of fat (IL) but not control (PBS) robustly activates the cNST. Scale bars, 100 µm. k, Quantification of Fos-positive neurons in animals infused with control and IL stimuli, Two-sided Mann–Whitney U-test between control and Intralipid (n = 5 mice), P = 8x10⁻³. l, We note that we often observe variable labeling in the area postrema (see Fig. 1c and panel jhere), but such labeling is independent of oral versus intragastric infusion4. The bar graphs show the quantification of Fos+ neurons in the area postrema (AP) and cNST (Fig. 1d) in response to free licking of IL (90 min) versus intragastric infusion (n = 5 mice). cFos in cNST: oral 105 ± 6, infusion 99 ± 6, cFos in AP: oral 93 ± 15, infusion 90 ± 12. The equivalent area of the cNST (bregma − 7.5 mm) was processed and counted for the different experiments. Two tailed unpaired t-test, cNST: P = 0.54; AP: P = 0.86. Values are mean ± s.e.m.

