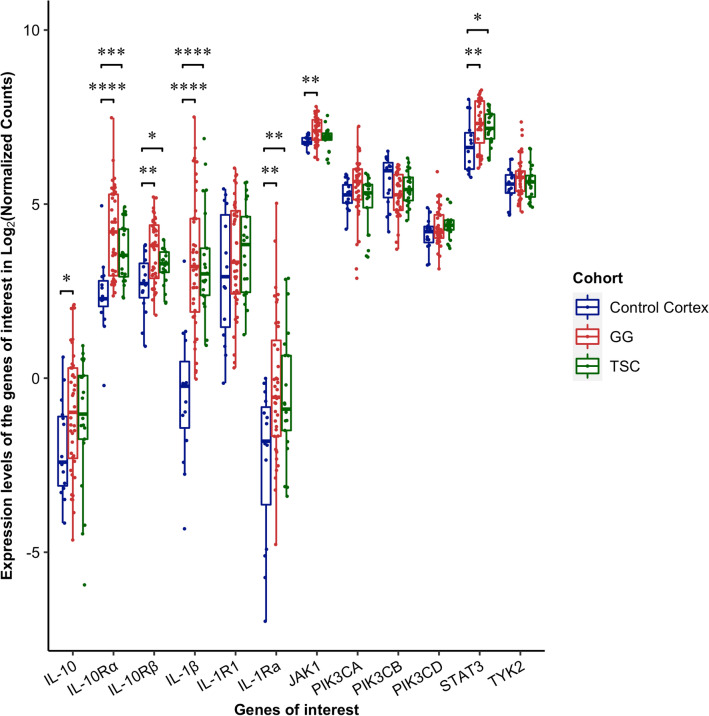
Figure 1.
Expression of genes of interest in controls, GG and TSC. RNAseq data indicate significant up-regulation (adjusted p value = 0.05) of IL-10Rα, IL-10Rβ, IL-1Ra, IL-1β and STAT3 in both GG and TSC. In addition, there is a significant upregulation of IL-10 and JAK1 in GG. IL-10 downstream signaling protein such as TIK1, phosphokinases (PIK3CA, PIK3CB, PIK3CD) and IL1-R1 did not show significant changes in either GG or TSC vs controls. * p < 0.05; ** p < 0.01; *** p < 0.001; **** p < 0.0001. A linear model was fit for each gene and moderated t-statistic was calculated after applying an empirical Bayes smoothing to the standard errors. Those genes with a Benjamini–Hochberg adjusted p value < 0.05 were considered significant. Differential expression analysis compared 21 TSC patients and 15 matched control cortices; 37 GG patients and 15 matched controls cortices.

