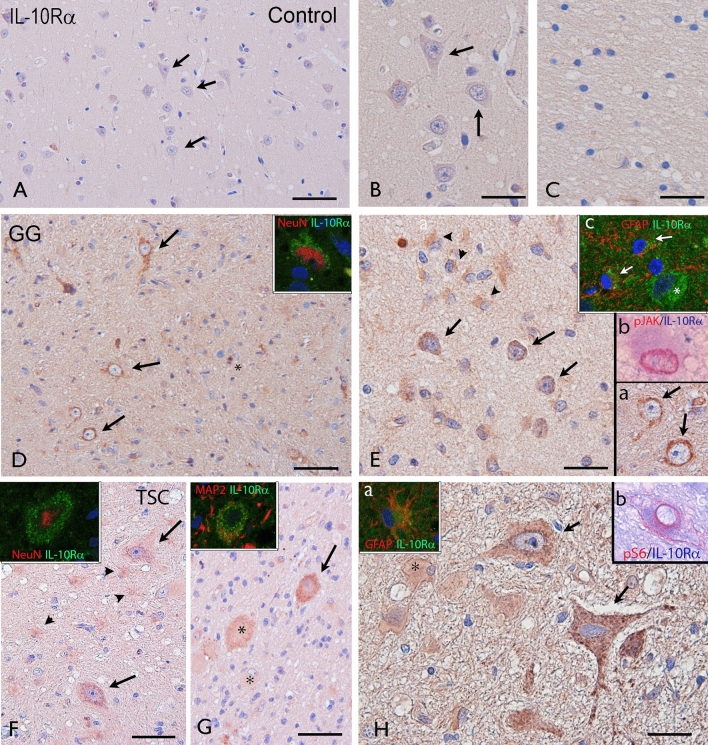
Figure 2.
Cellular expression pattern of IL-10 receptor in GG and TSC. Representative photomicrographs of immunocytochemical staining for IL-10Rα. Sections are counterstained with haematoxylin. Panels (A–C): IL-10Rα immunoreactivity (IR) in control brain. No detectable neuronal or glial labelling is observed in normal cortex (A–B; arrows indicate neurons) and white matter (C). Panels (D–E): IL-10Rα in gangliogliomas (GG). IL-10Rα IR was observed in dysplastic neurons (arrows, D and insert-a in E); insert in D shows expression of IL-10Rα (green) in a NeuN positive (red) dysplastic neuron; insert-b in E shows co-localization of IL-10Rα (blue) with pJAK (red). IL-10Rα IR was observed in scattered astroglial cells (arrowheads in E); insert-c in E shows co-localization of IL-10Rα (green) with GFAP (red). Panels (F–H): IL-10Rα in tuberous sclerosis complex (TSC). IL-10Rα IR was observed in dysmorphic neurons (arrows and inserts in F and H); IR was also observed in astrocytes (arrowheads; insert in H-a) and few giant cells (asterisks) within the dysplastic area. Insert in (F) shows expression of IL-10Rα (green) in a NeuN positive (red) dysmorphic neuron. Insert in (G) shows co-localization of IL-10Rα (green) with MAP2 (red). Insert (a) in (H) shows co-localization of IL-10Rα (green) with GFAP (red). Insert (b) in (H) shows co-localization of IL-10Rα (blue) with pS6 (red) in a dysmorphic neuron. Scale bar: (A, D): 100 µm; (F, G): 80 µm; (B, C, E): 40 µm; (H): 30 µm. Details on the cohort used are reported in Supplementary Information.

