Figure 3.

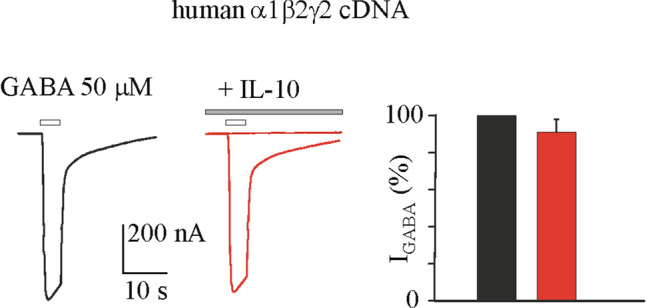
IL-10 effect on GABA current amplitude in oocytes injected with human α1β2γ2 cDNA. The bar-graph represents the mean and ± s.e.m. of the IGABA amplitudes evoked from oocytes intranuclearly injected with α1β2γ2 cDNAs before (black) and after (red) the incubation with IL-10 (200 ng/mL, 3 h; n = 8; p > 0.05 by paired t-test).The IGABA amplitudes recorded after the IL-10 incubation were normalized to the response obtained before exposure to IL-10 for each cell (range of current amplitudes: from 247.5 to 1119.0 nA), then averaged and expressed as a percent variation. Traces depict representative currents measured after 4 s application of GABA (white bar, 50 μM) in oocytes injected with α1β2γ2 cDNAs before (black trace) and after (red trace) IL-10 incubation (for 3 h). Grey bar on the right trace represents the block by 100 μM bicuculline (representative of 4 experiments).
