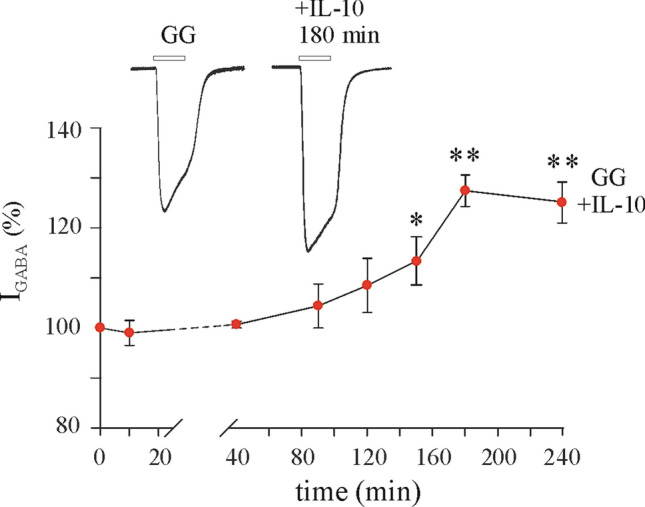
Figure 4.

Time-course effect of IL-10 on GABA current amplitude in oocytes microinjected with GG tissue. GABA alone was applied at 250 μM at the beginning of each experiment (time zero) and at various time points after treatment with 100 ng/ml IL-10. Data (mean ± s.e.m.; n = 6–12 oocytes/time point; patients #8–12 in Table 1) represent the percentage increase of the peak amplitude induced by IL-10. Data were normalized to the mean current amplitude recorded at time zero (23.7 ± 8.6 nA, n = 12). Inset: Traces depict representative GABA currents at the indicated times. * = p < 0.05 by Wilcoxon signed rank test; ** = p < 0.01 by paired t-test.
