Figure 5.
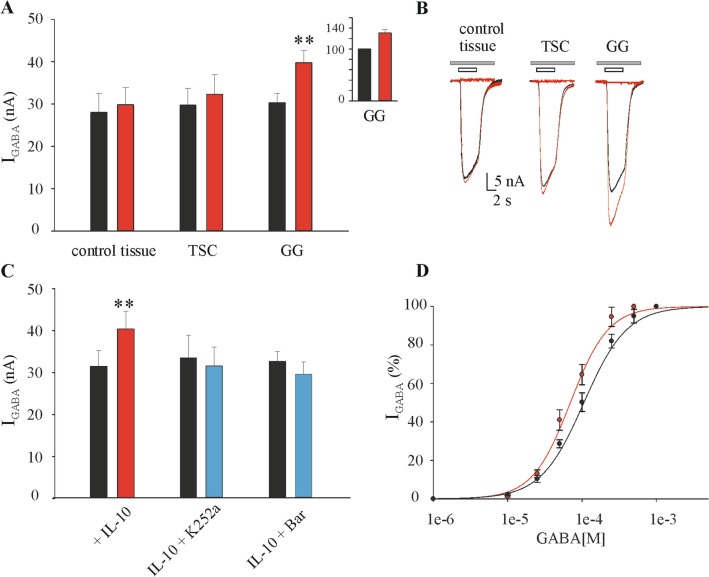
Characterization and blockade of IL-10 effect on GABA current amplitude. (A) Bar-graph of IL-10 effect on IGABA current amplitude in oocytes microtransplanted with control tissue (n = 17), TSC (n = 24) and GG (n = 80) tissues. Data are expressed as mean ± s.e.m. Inset: IGABA amplitude is expressed as percent increase above baseline (before IL-10 incubation, ranges of current amplitudes: control tissue, from 3.8 to 53.7 nA; TSC, from 7.7 to 73.7 nA; GG, from 5.5 to 84.0 nA). ** = p < 0.01 by paired t-test. (B) Representative superimposed current traces (GABA 250 μM, white bars) of control-, TSC- and GG-injected oocytes before (black trace) and after (red trace) incubation with IL-10 (100 ng/mL for 3 h). Grey bars represent the block by 100 μM bicuculline (representative of 3 experiments for each tissue) (C) Bar-graph shows the effect of incubation of K252a (2 μM, a broad-spectrum protein kinases inhibitor) or baricitinib (Bar 0.5 μM, a selective JAK1 and JAK2 inhibitor) with IL-10 (100 ng/ml). Black bar-graph represents the mean current value (nA) before incubation with IL-10 alone (red, n = 18) or in combination with the two blockers (blue, n = 8 for each blocker). ** = p < 0.01 by paired t-test (D) Dose–response curves of GABA (1 μM–1 mM) before (black curve) and after (red curve) incubation with IL-10 (100 ng/ml for 3 h) in oocytes microinjected with GG tissues (Patients # 8–10, Table 1). Averaged EC50 were 107.0 ± 9.7 μM, nH = 1.4 ± 0.10, before IL-10 and 67.0 ± 3.79 μM, nH = 1.77 ± 0.16; n = 16; statistics for the dose–response experiments: p < 0.05 by paired t-test.

