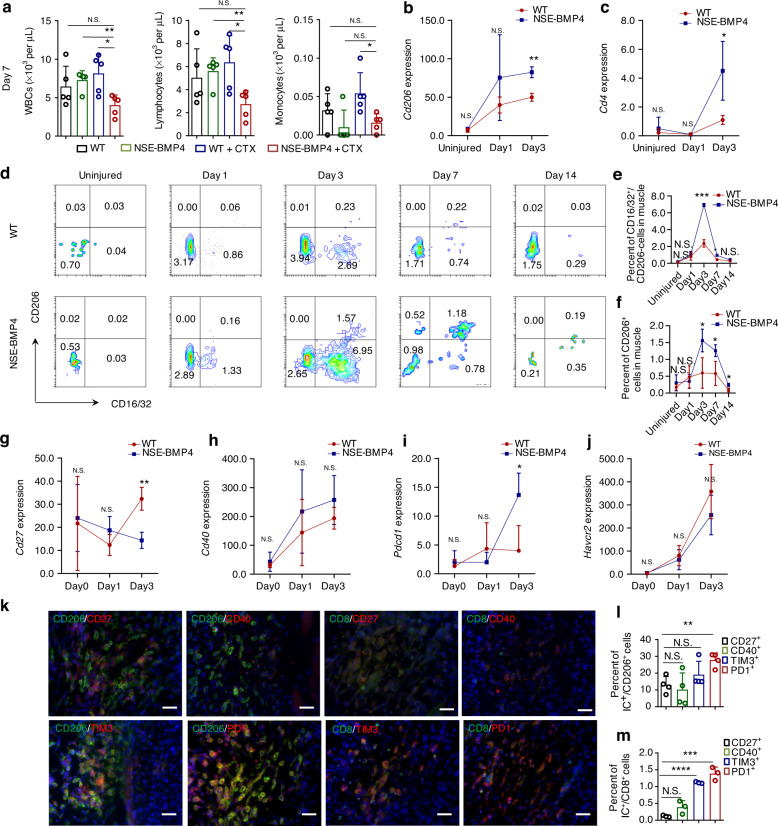
Fig. 4.
A suppressive immune response is a hallmark of HO propagation with bone loss. a Statistical analysis of peripheral WBCs, lymphocytes and monocytes in the WT and NSE-BMP4 mice at 7 dpi (n = 5 from three independent experiments). Data are presented as the mean ± s.d. of biological replicates. *P < 0.05, **P < 0.01, N.S. indicates no significance (unpaired two-tailed t test). Statistical analysis of the expression of Cd206 (b) and Cd4 (c) in the WT and NSE-BMP4 mouse muscle via an RNA-sequencing assay (n = 3 per group). Data are presented as the mean ± s.d. of biological replicates. *P < 0.05, **P < 0.01. N.S. indicates no significance. d Representative flow cytometry images of macrophage polarization in uninjured or injured muscle from the WT and NSE-BMP4 mice. Statistical analysis of the population of M1 macrophages (e) and M2 macrophages (f) in uninjured or injured muscle from the WT and NSE-BMP4 mice (n = 3 per group). Data are presented as the mean ± s.d. of biological replicates. *P < 0.05, ***P < 0.001. N.S. indicates no significance (unpaired two-tailed t test). g–j, Statistical analysis of the expression of Cd27, Cd40, Pdcd1 and Havcr2 in injured muscle from the WT and NSE-BMP4 mice at different postinjury times (n = 3 per group). Data are presented as the mean ± s.d. of biological replicates. *P < 0.05, **P < 0.01. N.S. indicates no significance (unpaired two-tailed t test). k At 7 dpi, immunostaining showed colocalization of CD206 or CD8 and immune checkpoint molecules in HO lesions. l, m Statistical analysis of the population of CD206+ or CD8+ cells expressing immune checkpoint molecules (n = 3 per group, n = 3 ROI/mouse). Data are presented as the mean ± s.d. of biological replicates. **P < 0.01, ***P < 0.001, ****P < 0.000 1. N.S. indicates no significance (unpaired two-tailed t test)

