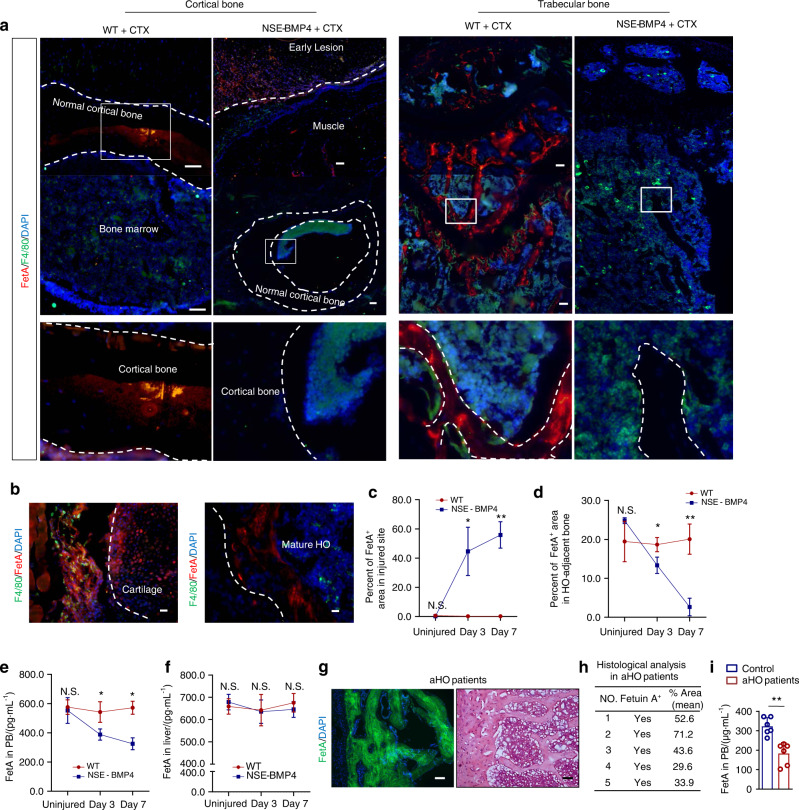
Fig. 6.
FetA is detected frequently in HO lesions but rarely in normal bone. a Immunostaining images of FetA in the cortical and trabecular bone of the injured WT mice and HO lesions and adjacent bone. Scale bar, 200 μm. b Immunostaining images of FetA+ and F4/80+ cells at the cartilage-developing stage and mature HO stage. Scale bar, 200 μm. c Statistical analysis of the FetA+ area in uninjured or injured muscle from the WT and NSE-BMP4 mice at different postinjury times (n = 3, n = 3 ROI/mouse). Data are presented as the mean ± s.d. of biological replicates. *P < 0.05, **P < 0.01 (unpaired two-tailed t test). d Statistical analysis of the FetA+ area in normal bone (from the injured WT mice) and HO-adjacent bone (from the injured NSE-BMP4 mice) at different postinjury times (n = 3 ROI/mouse). Data are presented as the mean ± s.d. of biological replicates. *P < 0.05, **P < 0.01 (unpaired two-tailed t test). Statistical analysis of FetA expression in the peripheral blood (n = 5) (e) and liver (n = 5) (f) of the uninjured or injured WT and NSE-BMP4 mice by ELISAs. Data are presented as the mean ± s.d. of biological replicates. *P < 0.05, N.S. indicates no significance (unpaired two-tailed t test). g Representative FetA immunostaining and HE staining images of HO samples from patients with aHO. Scale bar, 200 μm. h Histological analysis of the FetA+ region in the mature HO lesions of patients with aHO (n = 5 donors). Data are presented as the mean ± s.d. of biological replicates. i Statistical analysis of FetA expression in the blood of patients with aHO and healthy controls (n = 5 donors). Data are presented as the mean ± s.d. of biological replicates. **P < 0.01 (unpaired two-tailed t test)

