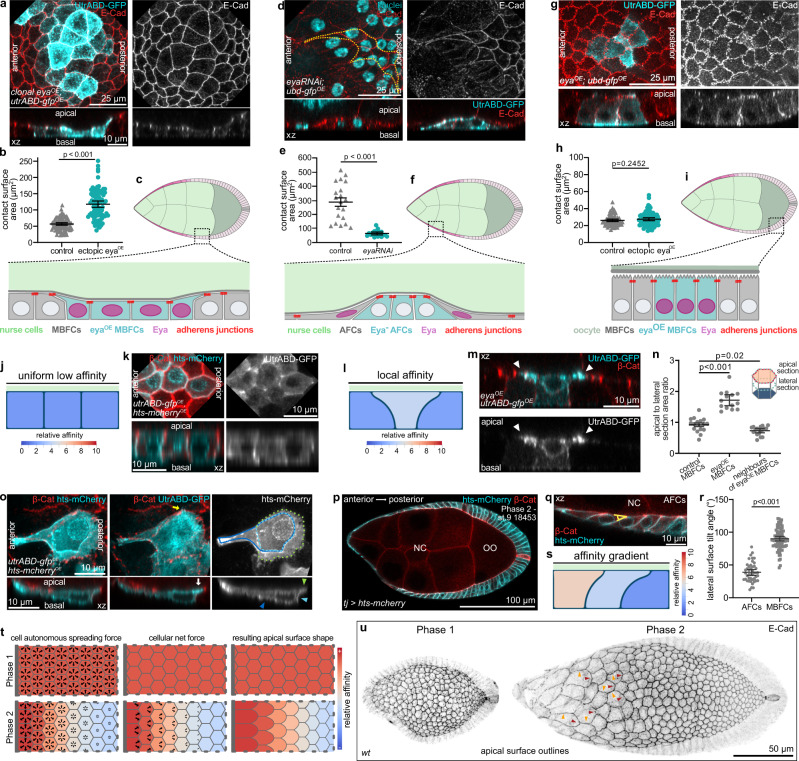
Fig. 3. Eya expression in FCs induces Affinity for Nurse Cells.
a MBFCs in contact with nurse cells during phase 2 with clonal expression of utrABD-gfp and ectopically expressing Eya (eyaOE), stained for E-Cad. Apical surface projection and xz-reslice shown. b Quantification of apical contact surface areas of control MBFCs and eyaOE-MBFCs in contact with nurse cells during phase 2. Mean+95% CI. Two-tailed Welch’s t-test. n (control: 71 MBFC, eyaOE: 64 MBFC). c Illustration of cell morphologies upon ectopic eyaOE expression in MBFC clones in contact with nurse cells during phase 2. d AFCs in contact with nurse cells during phase 2 with clonal expression of eya-RNAi, stained for E-Cad and nuclei (DAPI). Yellow line depicts clonal outline. Apical surface projection and xz-reslice shown. e Quantification of apical contact surface areas of control and eya-RNAi AFCs during phase 2. Mean+95% CI, two-tailed Welch’s t-test, n (control: 20 AFCs, eya-RNAi: 20 AFCs). f Illustration of cell morphologies upon eya-RNAi expression in AFCs during phase 2. g MBFCs in contact with the oocyte during phase 2 with clonal expression of utrABD-gfp and Eya (eyaOE), stained for E-Cad. Apical surface projection and xz-reslice shown. h Quantification of apical contact surface areas of control MBFCs and MBFCs ectopically expressing Eya (eyaOE) in contact with the oocyte. Mean+95% CI. Unpaired Student’s t-test. n (control: 75 cells, eyaOE: 83 cells). i Illustration of cell morphologies upon Eya (eyaOE) expression in MBFC clones in contact with the oocyte during phase 2. j Phase field model of 3 FCs in contact with nurse cells with low and equal affinities. k MBFCs in contact with nurse cells during phase 2 with clonal expression of utrABD-gfp and hts-mCherry (membrane), stained for β-catenin. Apical surface projection and xz-reslice shown. l Phase field model of 3 FCs in contact with nurse cells with the central cell developing a relatively higher affinity. m MBFCs in contact with nurse cells during phase 2 with one MBFC expressing utrABD-gfp and Eya (eyaOE), stained for β-catenin. xz-reslice shown. White arrowheads point to apical actin-rich protrusions extending towards neighbouring Eya-negative FCs. n Quantification of apical to lateral area ratios (see illustration and Fig S3a) for control MBFCs, eyaOE-MBFCs and direct neighbours of eyaOE-MBFCs. Mean+95% CI, Welch one-way Anova with Dunnett’s T3 multiple comparisons test. n (control MBFCs: 16 cells, eyaOE-MBFCs: 14 cells, neighbours: 18 cells). o AFCs in phase 2 with clonal expression of utrABD-gfp and hts-mcherry, stained for β-catenin. Dotted lines outline apical (green), lateral (light blue) and basal (dark blue) surfaces. Arrowhead of same colour marks surfaces in xz. Yellow arrow points at actin-based filopodium. White arrow points at actin rich apical surface protrusion. Max projection of whole cell and xz-reslice shown. p Medial confocal section of a phase 2 egg chamber expressing hts-mCherry under the control of tj-GAL4 (FC driver), stained for β-cat. Germline area in µm2. q Tilt of lateral membranes in AFCs. Angle for quantification is depicted in yellow. r Quantification of angles between lateral membranes and the germline surface in AFCs and MBFCs. Mean+95% CI, two-tailed unpaired t-test, n (45 AFCs, 82 MBFCs, 4 ECs). s Phase field model of 3 FCs with an affinity gradient. t Illustration of cell-autonomous spreading as a function of affinity, the resulting forces and apical surface shapes as a result of phase 1 and 2 affinity patterns. Grey bar represents anterior tip in egg chambers. u Local z-projection of the FC junctional network. wt ECs, stained for E-Cad. Orange arrowheads point at junctions between cells of the same row that remain straight, and red arrowheads point at convex junctions between FCs of different rows with different affinities. See Supplementary Table 7 for detailed statistical information. Source data are provided as a Source Data file.

