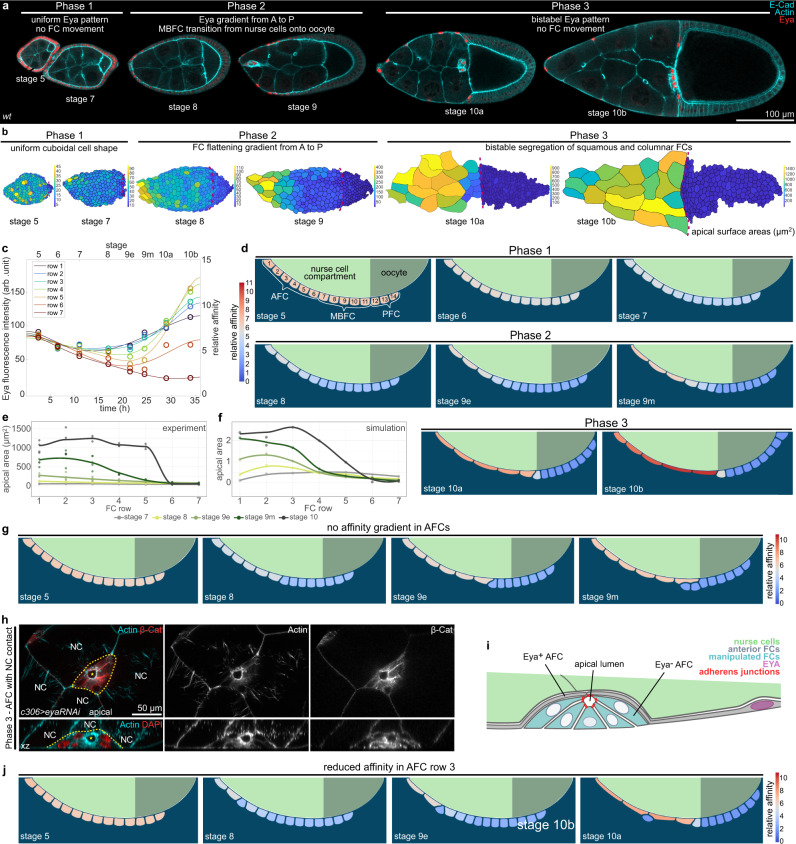
Fig. 4. Eya-regulated affinity accounts for FC dynamics throughout egg chamber development.
a Medial confocal sections of ECs stained for E-Cad, F-Actin and Eya. b Segmented apical surface areas of FCs in ECs. Red dotted line marks nurse cell–oocyte boundary. Colour scale bar shows apical surface area sizes in (µm2). c Average Eya fluorescence intensities of the 7 anterior rows as a function of time. Time denotes hours after the beginning of stage 5. Intensities are assigned to the midpoint of each stage. Eya dynamics serve as proxy for affinity dynamics in simulations (Supp. File S1). Row 1-6 dynamics were assigned to cells 1-6 (AFCs) and row 7 dynamic was assigned to cells 7–14 (MBFCs) in the phase field model. n (stage 5: 5 ECs, stage 6: 5 ECs, stage 7: 5 ECs, stage 8: 4 ECs, stage 9e: 8 ECs, stage 9m: 9 ECs, stage 10a: 5 ECs, stage 10b: 5 ECs). 6th order polynomial fit constrained to have vanishing derivatives at t = 0 and t = 36 hours. d Phase field model simulating collective behaviour of FCs as a function of their affinity for germline cells. wt affinity dynamics are based on measured Eya levels. e Apical surface area of the 7 anterior cell rows in stage 7-10 wt ECs. Apical surface area gradient first appears at stage 8. Stage 10a and 10b were pooled (stage 10). n (stage 7: 4 ECs, stage 8: 3 ECs, stage 9e: 5 ECs, stage 9 m: 5 ECs, stage 10: 3 ECs). f Apical surface areas of the 7 anterior cells in the simulation ((apical length)2). Apical surface area gradient first appears at stage 8 and develops with similar dynamics as observed in vivo. g Phase field model simulating collective behaviour of FCs as a function of their affinity for germline cells. All 6 AFCs share row 1 high-affinity dynamics. h AFCs expressing eya-RNAi under the control of c306-GAL4 (variegated AFC driver, c306>eya-RNAi). AFCs of a phase 3 EC, stained for β-cat, F-Actin and nuclei (DAPI). Formation of an apical lumen (yellow star) in eya-RNAi AFC cluster (yellow dotted line). NC marks nurse cells. Section through apical lumen and xz-reslice shown. i Illustration of cell morphologies upon eya-RNAi knockdown in a group of AFCs in contact with nurse cells during phase 3. j Phase field model simulating the collective behaviour of FCs as a function of their affinity for germline cells. Reduction in affinity in row 3 causes a failure to flatten and drives displacement of AFC from the nurse cell surface. See Supplementary Table 7 for detailed statistical information. Source data are provided as a Source Data file.

