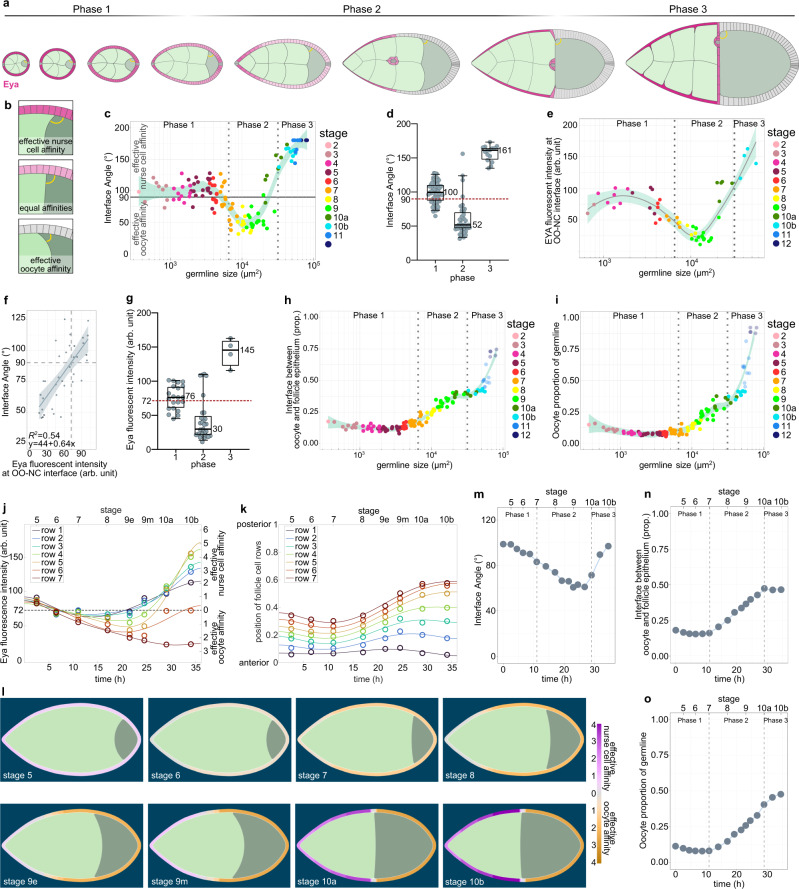
Fig. 6. Eya-controlled effective germline affinities account for oocyte growth and shape dynamics.
a Illustrations of ECs depicting the interface angle and Eya expression patterns. b Illustration of the interface angle as a parameter characterizing effective affinities of oocyte or nurse cells towards FCs. c Interface angle as a function of the germline area. Dotted lines mark germline sizes at the transition between two phases. LOESS fitted with a 95% CI area. n = 126 ECs. d Interface angle of wt ECs grouped into the three morphogenetic phases. Box plot with whiskers marking the 5th and 95th percentile. Numbers state the median of the corresponding phase. n (phase 1: 62 ECs, phase 2: 39 ECs, phase 3: 15 ECs) e Eya levels in FCs at the nurse cell–oocyte boundary as a function of germline area. Dotted lines mark germline sizes at the transition between two phases. LOESS fitted with a 95% CI area. n = 54 ECs. f Linear regression between the interface angle and Eya levels of FCs in contact with the nurse cell–oocyte boundary. Dashed line marks 90° angle. Linear regression with 95% CI area, n = 36 ECs. g Eya levels of FCs at nurse cell–oocyte boundary of wt ECs grouped into the three morphogenetic phases. Box plot with whiskers marking the 5th and 95th percentile. Number states median of the corresponding phase. n (phase 1: 19 ECs, phase 2: 29 ECs, phase 3: 4 ECs) h Oocyte–FC interface proportion of germline-FC interface as a function of germline area. LOESS fitted with a 95% CI area. n = 126 ECs. i Oocyte area proportion of the germline as a function of the germline area. Dotted lines mark germline sizes at the transition between two phases. LOESS fitted with a 95% CI area. n = 126 ECs. j Average Eya fluorescence intensity of the first 7 anterior FC rows as a function of time. Time denotes hours after the beginning of stage 5. Eya dynamics of rows serve as proxy for effective affinity dynamics implemented in simulations (Supp. File S1). n (stage 5: 5 ECs, stage 6: 5 ECs, stage 7: 5 ECs, stage 8: 4 ECs, stage 9e: 8 ECs, stage 9 m: 9 ECs, stage 10a: 5 ECs, stage 10b: 5 ECs). 6th order polynomial fit constrained to have vanishing derivatives at t = 0 and t = 36 hours. k Average normalized distances to anterior pole of the 7 anterior FC rows as a function of time. Distances and intensity dynamics were used to simulate effective affinities of germline cells (Supp. File S1). Row 7 affinity dynamic was assigned from the distance of row 7 to the posterior pole. n (stage 5: 5 ECs, stage 6: 5 ECs, stage 7: 5 ECs, stage 8: 4 ECs, stage 9e: 8 ECs, stage 9 m: 9 ECs, stage 10a: 5 ECs, stage 10b: 5 ECs). l Phase field model simulating germline cell behaviour as a function of their affinity for the follicle epithelium. wt affinity dynamics are based on measured Eya levels. m–o Individual morphological parameters of the simulation as a function of time. m Interface Angle. n Oocyte-FC interface proportion of the germline-FC interface. o Oocyte proportion of the germline. Phase boundaries were assigned to mid stage 7 and mid stage 10a. See Supplementary Table 7 for detailed statistical information. Source data are provided as a Source Data file.

