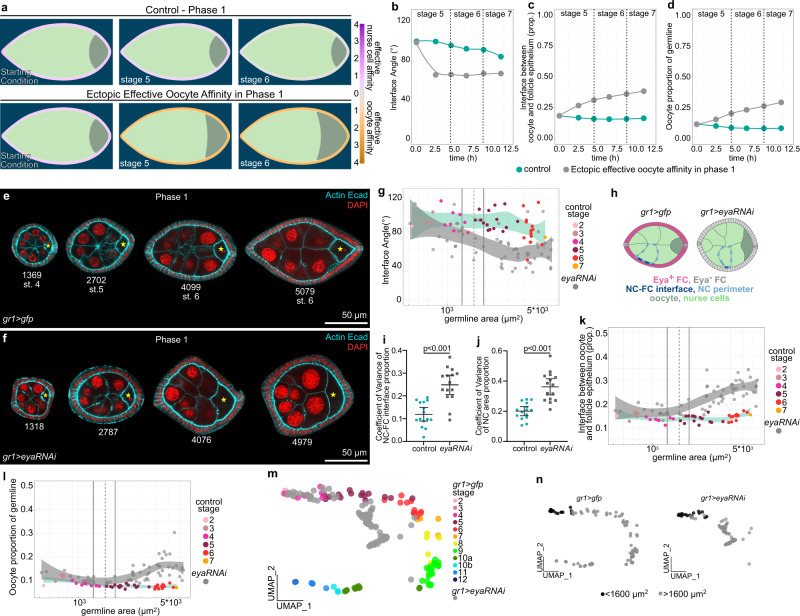
Fig. 7. Premature loss of Eya in FCs during phase 1 induces premature oocyte expansion.
a Phase field model simulating germline cell behaviour as a function of their affinity for the follicle epithelium. wt affinity vs. ectopic effective oocyte affinity in phase 1 (simulating phase 1 FC Eya loss). b–d Individual morphological parameters of the simulation as a function of time for phase 1. b Interface Angle. c Proportion of the germline-FC interface made up by the oocyte. d Oocyte proportion of the germline. e, f Medial confocal sections of phase 1 ECs expressing gfp (e) or eya-RNAi (f) under the control of gr1-GAL4 (gr1 > gfp, gr1 > eya-RNAi, FC driver), stained for E-Cad, F-Actin and nuclei (DAPI). Yellow stars mark oocytes. Numbers denote germline areas in µm2. g Interface Angle as a function of germline area of gr1 > gfp and gr1 > eya-RNAi ECs in phase 1 (germline area <6500µm2). Dotted line marks critical germline area and solid lines mark 95% CI. All curves are LOESS fitted with a 95% CI area. n (gr1 > gfp = 42 ECs, gr1 > eya-RNAi = 60 ECs). h Illustrations of gr1 > gfp and gr1 > eya-RNAi egg chambers in phase 1 (stage 6). i Quantification of the coefficient of variance (CV) of the nurse cell-FC interface (dark blue line) proportion of the nurse cell perimeter (light blue dotted line) within a nurse cell cluster. Mean+95%CI, two-tailed unpaired Student’s t-test, n (gr1 > gfp: 15 ECs, 71 NCs; gr1 > eya-RNAi: 15 ECs, 89 NCs). j Quantification of the coefficient of variance (CV) of nurse cell area proportions within a nurse cell cluster. Mean+95%CI, two-tailed unpaired Welch’s t-test, n (gr1 > gfp: 15 ECs, 71 NCs; gr1 > eya-RNAi: 15 ECs, 89 NCs). k Oocyte-FC interface proportion of germline-FC interface as a function of germline area of gr1 > gfp and gr1 > eya-RNAi ECs in phase 1 (germline area <6500 µm2). l Oocyte area proportion of the germline area as a function of germline area of gr1 > gfp and gr1 > eya-RNAi ECs in phase 1 (germline area <6500µm2). Dotted line marks critical germline area, solid lines mark 95% CI of critical germline area. Curves are LOESS fitted with a 95% CI area. n (gr1 > gfp = 42 ECs, gr1 > eya-RNAi = 60 ECs). m UMAP comparing gr1 > gfp and gr1 > eya-RNAi EC morphogenesis. n UMAP of gr1 > gfp and gr1 > eya-RNAi coloured by germline sizes smaller (black) and larger (grey) than the critical size (1600 µm2, see Supplementary Fig. 7). See Supplementary Table 7 for detailed statistical information. Source data are provided as a Source Data file.

