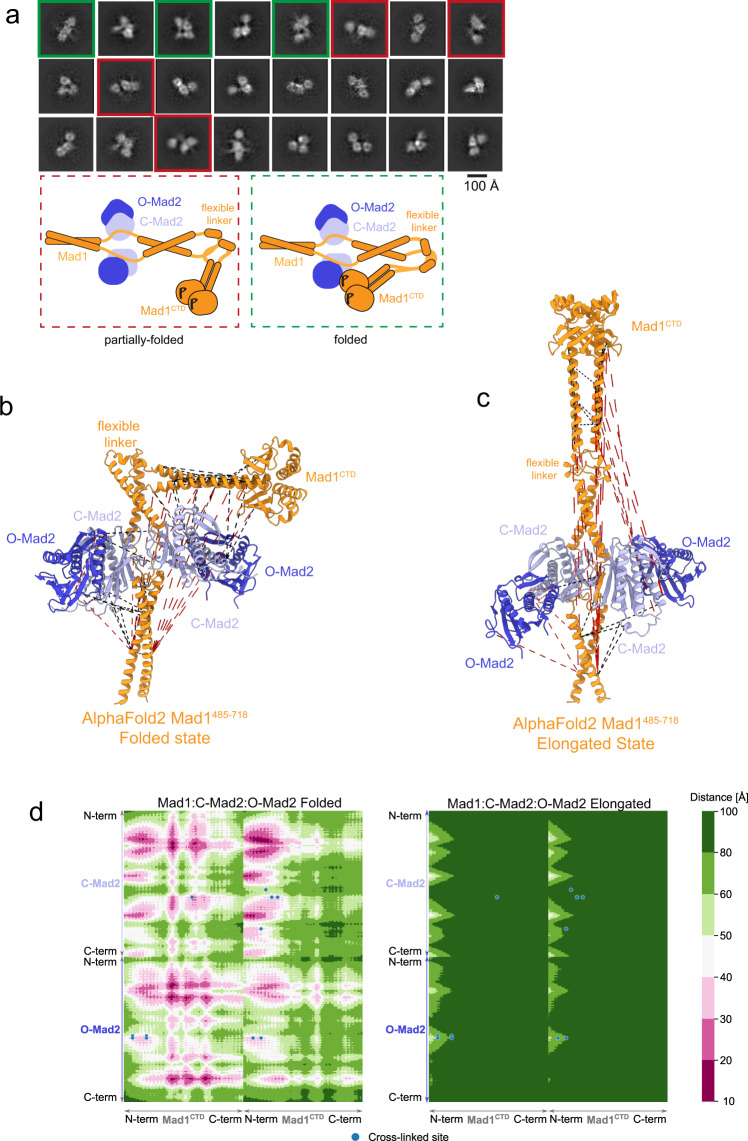
Fig. 6. Fold-over within the Mad1:Mad2 complex.
a 2D averages of BS3 cross-linked pMad1:C-Mad2:O-Mad2 complex by cryo-EM, representative of 125 2D classes. Classes showing complexes that appear only partially folded are boxed in red, and classes showing complexes that appear fully folded are boxed in green. A schematic of the suggested partially folded and folded states seen in the 2D averages is shown below. b Identified cross-links for the phosphorylated Mad1:C-Mad2:O-Mad2 complex were mapped onto a folded Mad1CTD state as predicted by AlphaFold2 (Supplementary Fig. 8d) where alignment of the folded AlphaFold2 Mad1485–718 structure onto the crystal structure of Mad1485–584:C-Mad2 (PDB 1GO4)23 and C-Mad2:O-Mad2 dimer (PDB 2V64)26 was used to generate a model of the hexameric complex. Mad1 subunits (residues 485–718) are shown in orange, whereas C-Mad2 and O-Mad2 are coloured in light and dark blue, respectively. Mapped cross-links with a distance below 40 Å are indicated as black dashed lines and all others in red. For all obtained cross-links, only the shortest option is depicted. c The same as in (b) but identified cross-links are mapped onto the structure of Mad1:C-Mad2:O-Mad2 in the elongated state as predicted by AlphaFold2 (Supplementary Fig. 8c). d Cross-link contact map for the folded and elongated Mad1:C-Mad2:O-Mad2 complexes. Cross-link sites reflecting inter Mad1CTD:Mad2 cross-links are shown as blue circles. For simplicity, only contacts between dimeric Mad1CTD and the closest Mad2 heterodimer (C-Mad2 and O-Mad2) were calculated. Intra- and intermolecular distances are shown in accordance with the coloured scale bar.

