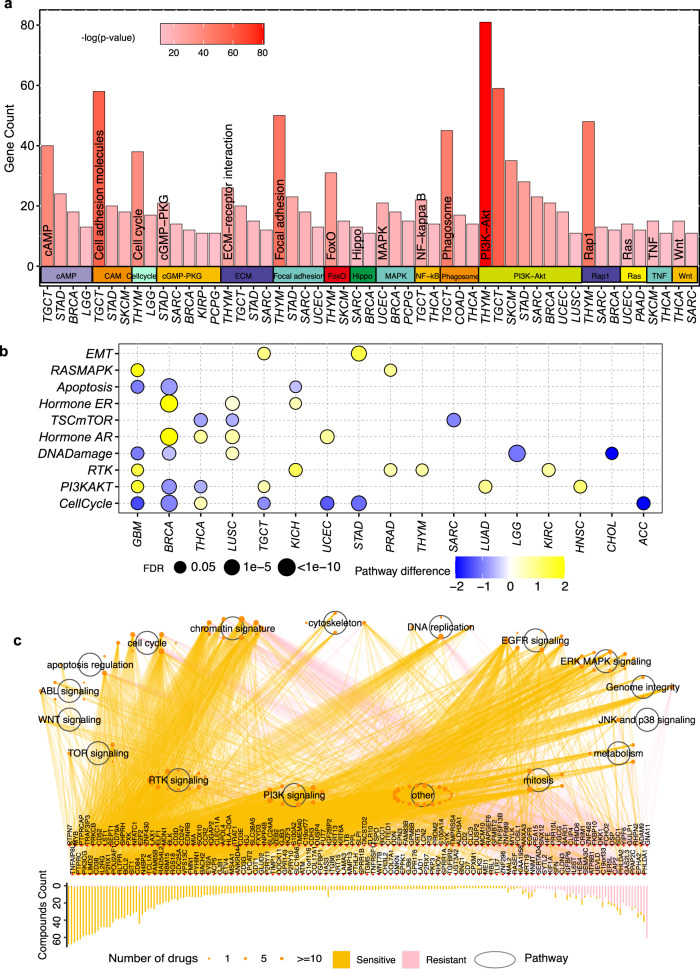
Fig. 3. Associations between autophagy and mRNA/ protein expression and signaling pathways.
a Enriched pathways with gene counts >10 in at least two cancers by significantly altered mRNAs in the comparison of the autophagy score-high group vs. the autophagy score-low group. Barplot indicates the enriched genes; barplot color intensity indicates the significance of the enriched pathways. Enrichment of pathways was evaluated with “clusterProfile” package. b Altered signaling pathways based on functional proteomics data of reverse-phase protein arrays in the autophagy score-high group vs. the autophagy score-low group for multiple cancers. Color indicates the difference in pathway score; point size indicates FDR for pathway score. c Spearman correlation between mRNA expression levels of autophagy-associated genes in different signaling pathways and area under the curve across 1074 cancer cell lines. Barplot denotes the number of drugs targeting each gene; the orange point shows the drug’s targeted pathway; the point size indicates the number of genes correlated with drug sensitivity (|Rs| >0.3, FDR < 0.05).

