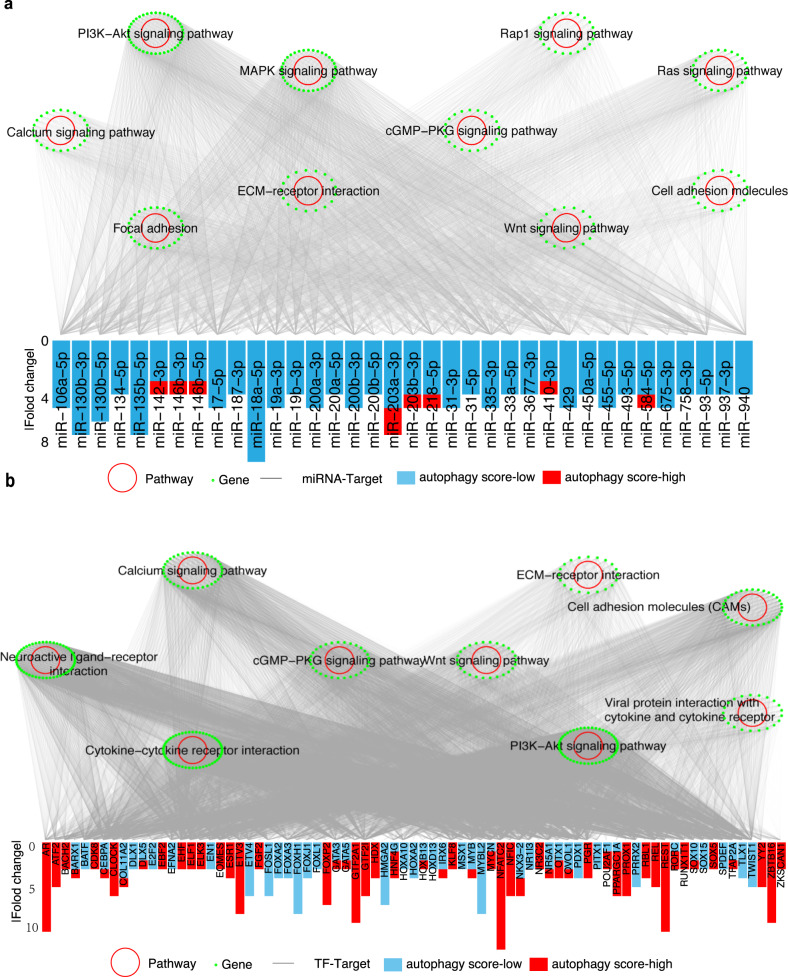
Fig. 4. miRNA-target and TF-target regulatory networks in autophagy.
a Significant KEGG pathways enriched by mRNAs in the miRNA-target regulatory network. Green dots: genes; red circles: enriched KEGG pathways with FDR < 0.05; barplot denotes the number of cancer types with altered miRNAs. Y-axis denotes |fold change|. b Significant KEGG pathways enriched by mRNAs in the TF-target regulatory network. Green points: genes; red circle: enriched KEGG pathways with FDR < 0.05; barplot denotes the number of cancer types with altered TFs. The y axis denotes |fold change|.

