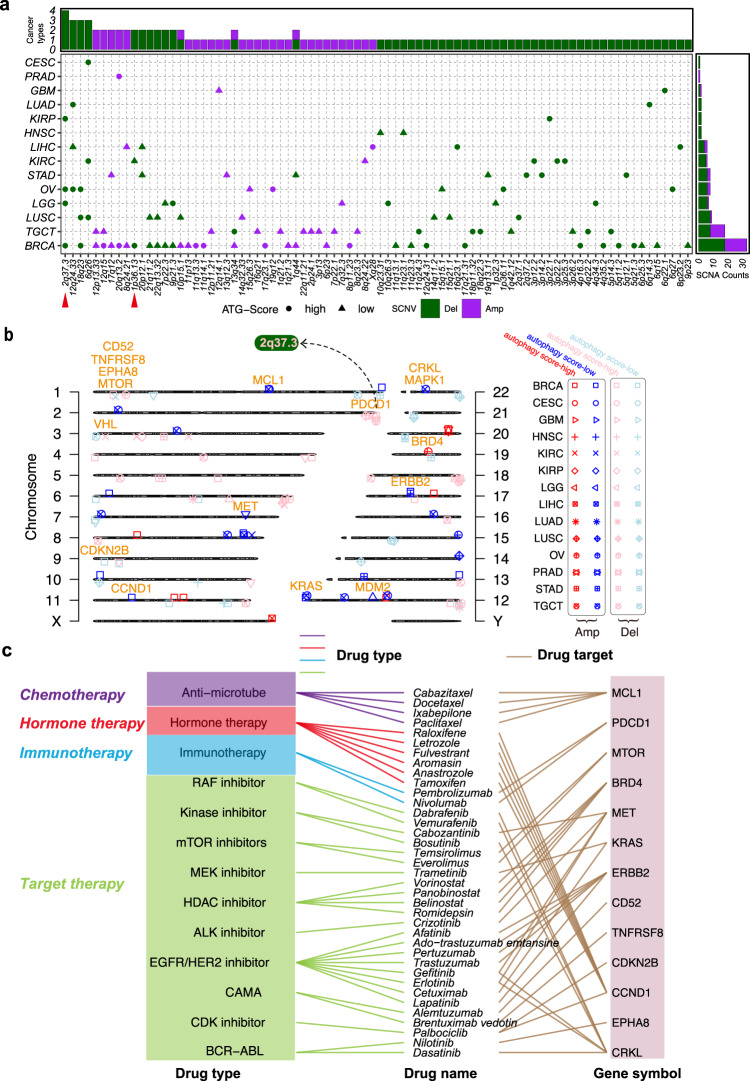
Fig. 5. Association between SCNAs and autophagy across multiple cancers.
a Summary characteristics of SCNAs across multiple cancers. The upper bar denotes the number of cancer types with amplifications (purple) or deletions (dark green); the right bar denotes the number of amplifications (purple) or deletions (dark green) in each cancer. Circles indicate the autophagy score-high; triangles indicate the autophagy score-low. b Chromosome plot displays locations of autophagy-associated SCNAs with significant alterations or harbored genes in the autophagy score-high group vs. the autophagy score-low group. Red indicates amplification; blue indicates deletion in the autophagy score-high group. Pink indicates amplification; light blue indicates deletion in the autophagy score-low group. The orange label shows CAGs. c FDA-approved drugs targeting CAGs in autophagy-associated SCNAs.

