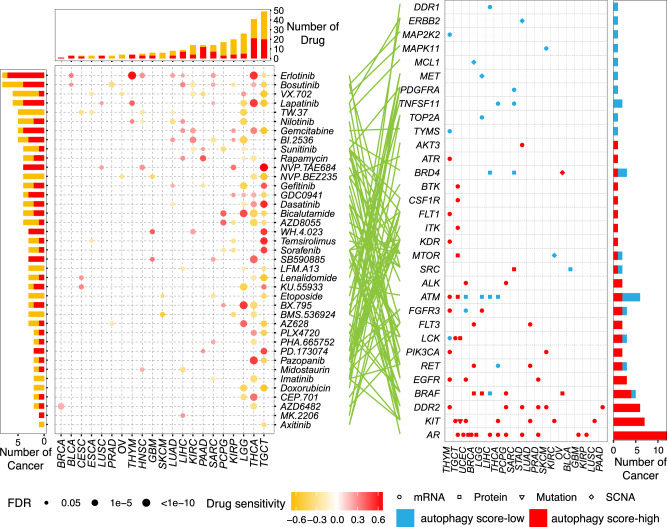
Fig. 6. Effects of molecular alterations in clinically actionable genes on drug response.
Sensitivity of drugs targeting clinically actionable genes with any alterations at the mRNA, protein, mutation, and SCNA levels. The point in the left panel indicates the Spearman correlation between imputed drug data and autophagy scores in multiple cancers (red: positive, drug-resistant; orange: negative, drug-sensitive). Different shapes in the right panel represent different types of molecular signatures. Red point: autophagy score-high group; blue point: autophagy score-low group.

