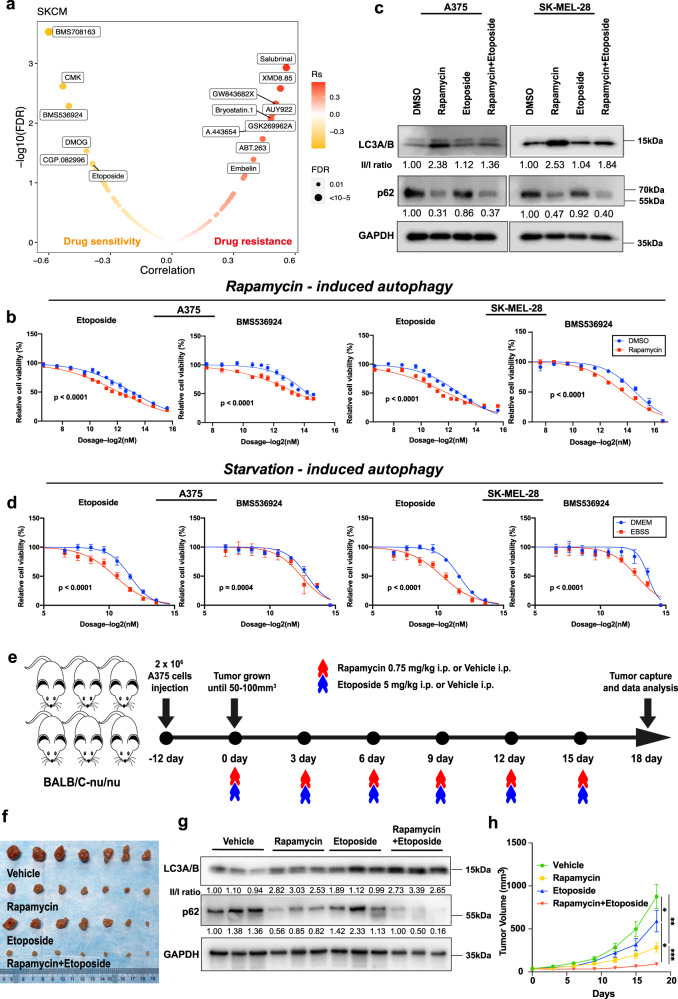
Fig. 7. Characterization of the drug response associated with autophagy in vitro and in vivo.
a Drug response associated with the autophagy status in SKCM. The orange point indicates sensitivity; the red point indicates resistance. b, d Dose-response curves for the mean value of cell viability of etoposide and BMS536924 in rapamycin-induced (b) or starvation-induced (d) and non-induced conditions in the melanoma cell line A375 and SK-MEL-28. Cell viability was normalized to the level of cells treated with DMSO (b) or DMEM (d). DMEM: Dulbecco’s Modified Eagle Medium for control. EBSS: Earle’s Balanced Salt Solution for starvation. Error bars indicate the mean ± SD. The drug screen data of different groups (n = 4) were fitted and compared by sigmoidal dose-response curves. c Western blot of autophagy markers in A375 and SK-MEL-28 cell lines treated with DMSO, rapamycin, etoposide, and rapamycin + etoposide. The ratios of the LC3-II/LC3-I and p62 band intensities normalized to DMSO are displayed below the blots. Similar results were observed in at least three independent experiments. e The design of xenograft experiments. Nude mice were injected with 2 × 10⁶ A375 cells. When the tumor size reached 50–100 mm3, mice were treated with vehicle, 0.75 mg/kg rapamycin intraperitoneally (i.p.), 5 mg/kg etoposide (i.p.), or the combination of rapamycin and etoposide every 3 days (n = 7). Mice were depicted using “mouse-animal-rodent-mammal-little” (https://pixabay.com/zh/vectors/mouse-animal-rodent-mammal-little-310756/), available under the Simplified Pixabay License (https://pixabay.com/zh/service/license/). f Excised tumors to represent the tumor size on day 18. g Western blot of autophagy markers in mouse tissues with the treatment of vehicle, rapamycin, etoposide, and rapamycin + etoposide. The ratios of the LC3-II/LC3-I and p62 band intensities normalized to vehicle are displayed below the blots (n = 3). h Quantitative analysis of tumor volume at different time points with the treatment (n = 7). Error bars indicate the mean ± SD. The difference in multiple groups was estimated by one-way ANOVA analysis. P values are as follows: p = 0.011 (Vehicle vs. Etoposide), p = 0.0012 (Vehicle vs. Rapamycin), p = 0.026 (Etoposide vs. Rapamycin+Etoposide), and p = 0.00058 (Rapamycin vs. Rapamycin+Etoposide). c, g See Supplementary Fig. 8 for uncropped data.

