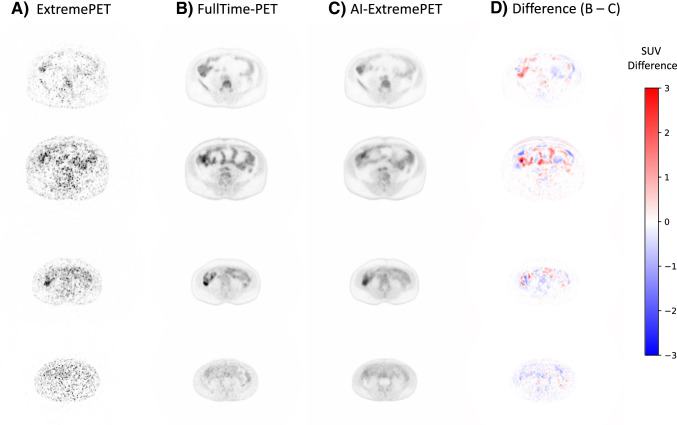
Fig. 3.
Collage of exemplary reconstructions from model M3 within the following order (left to right): Input (A), target (B), prediction (C), and difference map (D). The difference map is based on the subtraction of the original FullTime-PET with the AI-ExtremePET. Red spots indicate that the reconstructed intensity was lower than in the FullTime-PET, and blue spots indicate that the reconstructed intensity was higher than in the AI-ExtremePET

