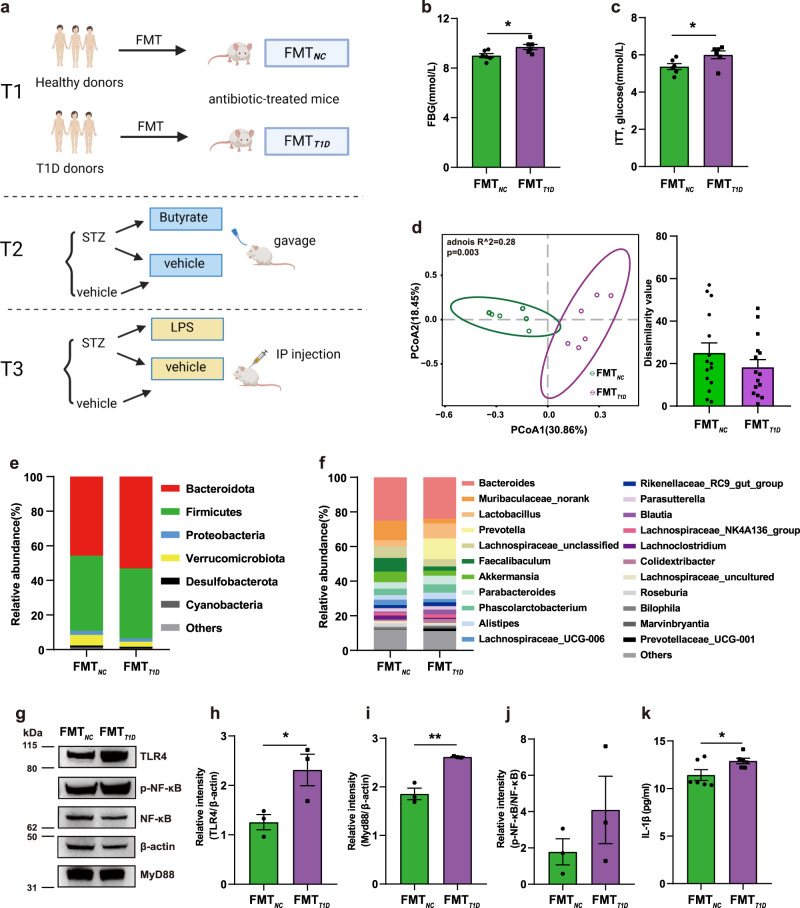
Fig. 5. Disturbed glucose homeostasis induced by the transplantation of T1D-associated gut microbiota.
a Schematic diagram of the study design. b Fasting blood glucose level (p = 0.025). c Glucose levels at 30 min after insulin injection in the ITT (p = 0.040). d PCoA plot based on the Bray-Curtis distances (left) and inner-group distance by ANOSIM analysis (right). e, f Microbial composition at the phylum (e) and genus (f) level. g Western blotting results depicting the TLR4, Myd88, and p-NF-κB protein expression levels in the liver. h–j Quantification of band intensities and normalization to β-actin (TLR4, p = 0.041; Myd88, p = 0.003). k The serum concentration of IL-1β (p = 0.043). FMTNC, mice recipients FMT with NC gut microbiota; FMTT1D, mice recipients FMT with T1D gut microbiota; ITT, insulin tolerance test. For b–f, k sample size is FMTNC: n = 6, FMTT1D: n = 6 as biologically independent samples. For g–j sample size is FMTNC: n = 3, FMTT1D: n = 3. Data represent the mean ± standard error of the mean (SEM). Unpaired two-sided t test. *p < 0.05, **p < 0.01. Source data are provided as a Source Data file.

